For an Australian household to be recorded as being in housing affordability stress (HAS) it has to be in the bottom 40 per cent of Australia’s income distribution and have housing costs that are greater than 30 per cent of its income. So what can the Census tell us about the incomes and thresholds of HAS for households in the first (Q1) and second (Q2) quintile (i.e. in the 0% to 20% range and the 21% to 40% range) of Australia’s income distribution?
Assuming an even and equal spread of households across each income range it is possible to approximate the gross income of a family or non-family household at the top of these lower quintiles. The table below shows the weekly incomes of households at the top of Q1 and Q2, the maximum household costs they can afford before being in housing affordability stress and how these figures have changed from 2011 to 2016.
Table 1: Household incomes and maximum housing costs (before being in HAS) of Q1 and Q2 households, 2011 and 2016.
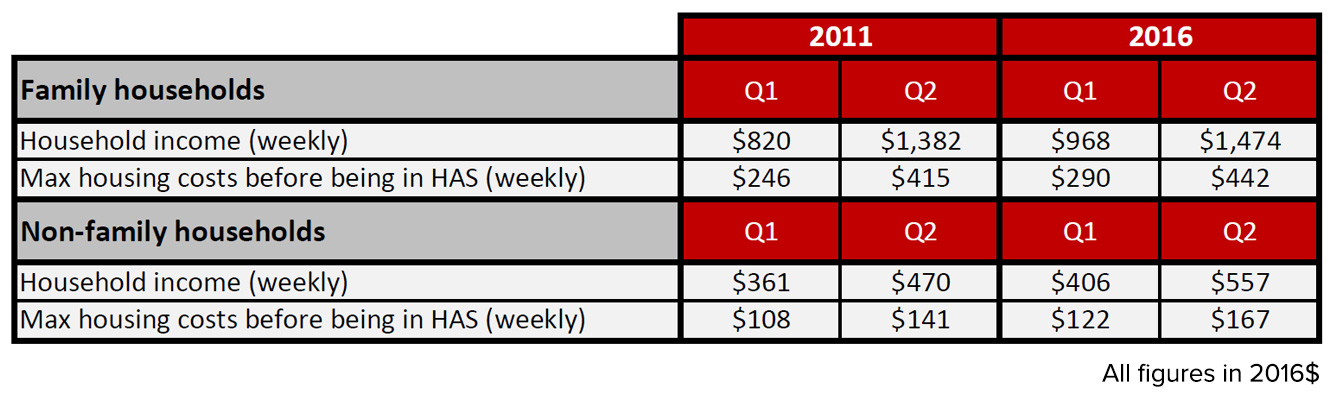
Sources: ABS 2016 Census. Australia, General Community Profile. Table G29 Total household income (weekly) by household composition, ABS 2011 Census. Australia, Basic community profile. B28 Total household income (weekly) by household composition