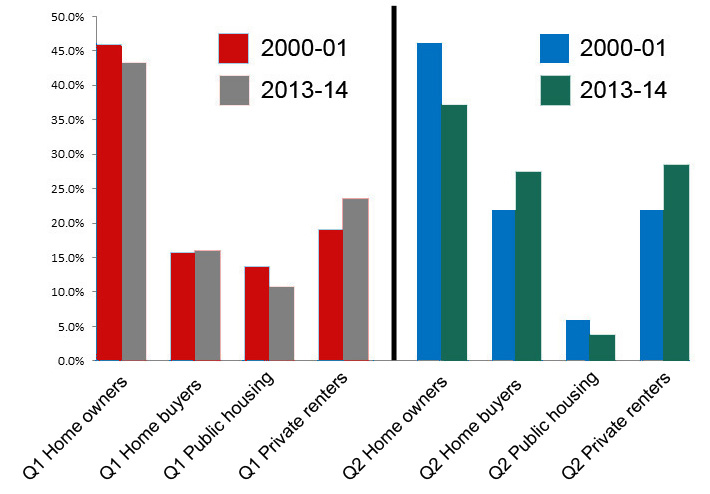
The most recent Housing Occupancy and Costs data from the ABS reveals that the percentage of Q1 and Q2 households who either own their home outright or are in public housing fell in the years between 2000–01 and 2013–14. This shows the shift for lower income households from more secure housing tenures (i.e. outright home ownership and public housing) to the less secure tenures of buying their own home and private rental.
The percentage of Q1 households in the private rental market increased from 19 per cent of households in 2000–01 to 24 per cent of households in 2013–14, and for Q2 households the percentage increased from 22 per cent of households in 2000–01 to 28 per cent of households in 2013–14.
The following graph shows the change in housing tenure for lower income (Q1 and Q2) Australian households between 2000–01 and 2013–14.