The release of the ABS Housing Occupancy and Costs data for 2017–18 reveals that, while the total number of households in Australia grew by 14.8 per cent in the decade 2007–08 to 2017–18, the total number of lower income households renting in the private rental sector (PRS) increased by 25 per cent (to 1,484,257 households). Over the same time period, the number of lower income rental households (LIRHs) in housing affordability stress (HAS: i.e. paying more than 30% of household income in housing costs) grew by 53.9 per cent (to 639,737 people).
Table 1: Change in lower income rental households (LIRH), LIRH in housing affordability stress (HAS), households and population in Australia and all states and territories, 2007 to 2018
| % increase in total LIRH | NSW | Vic. | Qld | SA | WA | Tas. | NT | ACT | Aust. LIRHS | Aust. |
|---|---|---|---|---|---|---|---|---|---|---|
| % increase in total LIRH 2007 to 2018 |
11.3% |
28.2% |
55.6% |
11.2% |
27.6% |
-0.5% |
-33.3% |
68.0% |
25.0% |
- |
| % increase LIRH in HAS 2007 to 2018 |
31.6% |
63.2% |
75.1% |
62.0% |
97.4% |
43.6% |
-24.8% |
81.8% |
53.9% |
- |
| % increase all households 2007 to 2018 |
10.4% |
21.9% |
18.8% |
5.7% |
14.3% |
6.1% |
6.2% |
16.6% |
- | 14.8% |
| % increase in population 2007 to 2018 |
13.9% |
21.5% |
17.1% |
8.4% |
20.6% |
5.8% |
11.2% |
19.5% |
- | 16.5% |
Source: ABS 4130.0, Housing Occupancy and Costs 2017–18. Table 21.1, Table 1.3, Table 13.3, Table 14.3, Table 15.3, Table 16.3, Table 17.3, Table 18.3, Table 19.3 and Table 20.3.
It is likely that for Victoria, Queensland, Western Australia and the ACT increases in overall population and LIRHs, together with the very small number of lower priced properties being built (between 2005 and 2014 only 6.7% of all houses and 3.4% of all units built were in the bottom 40% of house prices FR281p17 across Australia), has led to increased competition for affordable rental properties, resulting in an increase in households experiencing HAS.
Figure 1: Increase in total LIRH, LIRH in HAS and total Australian households, 2007 to 2018
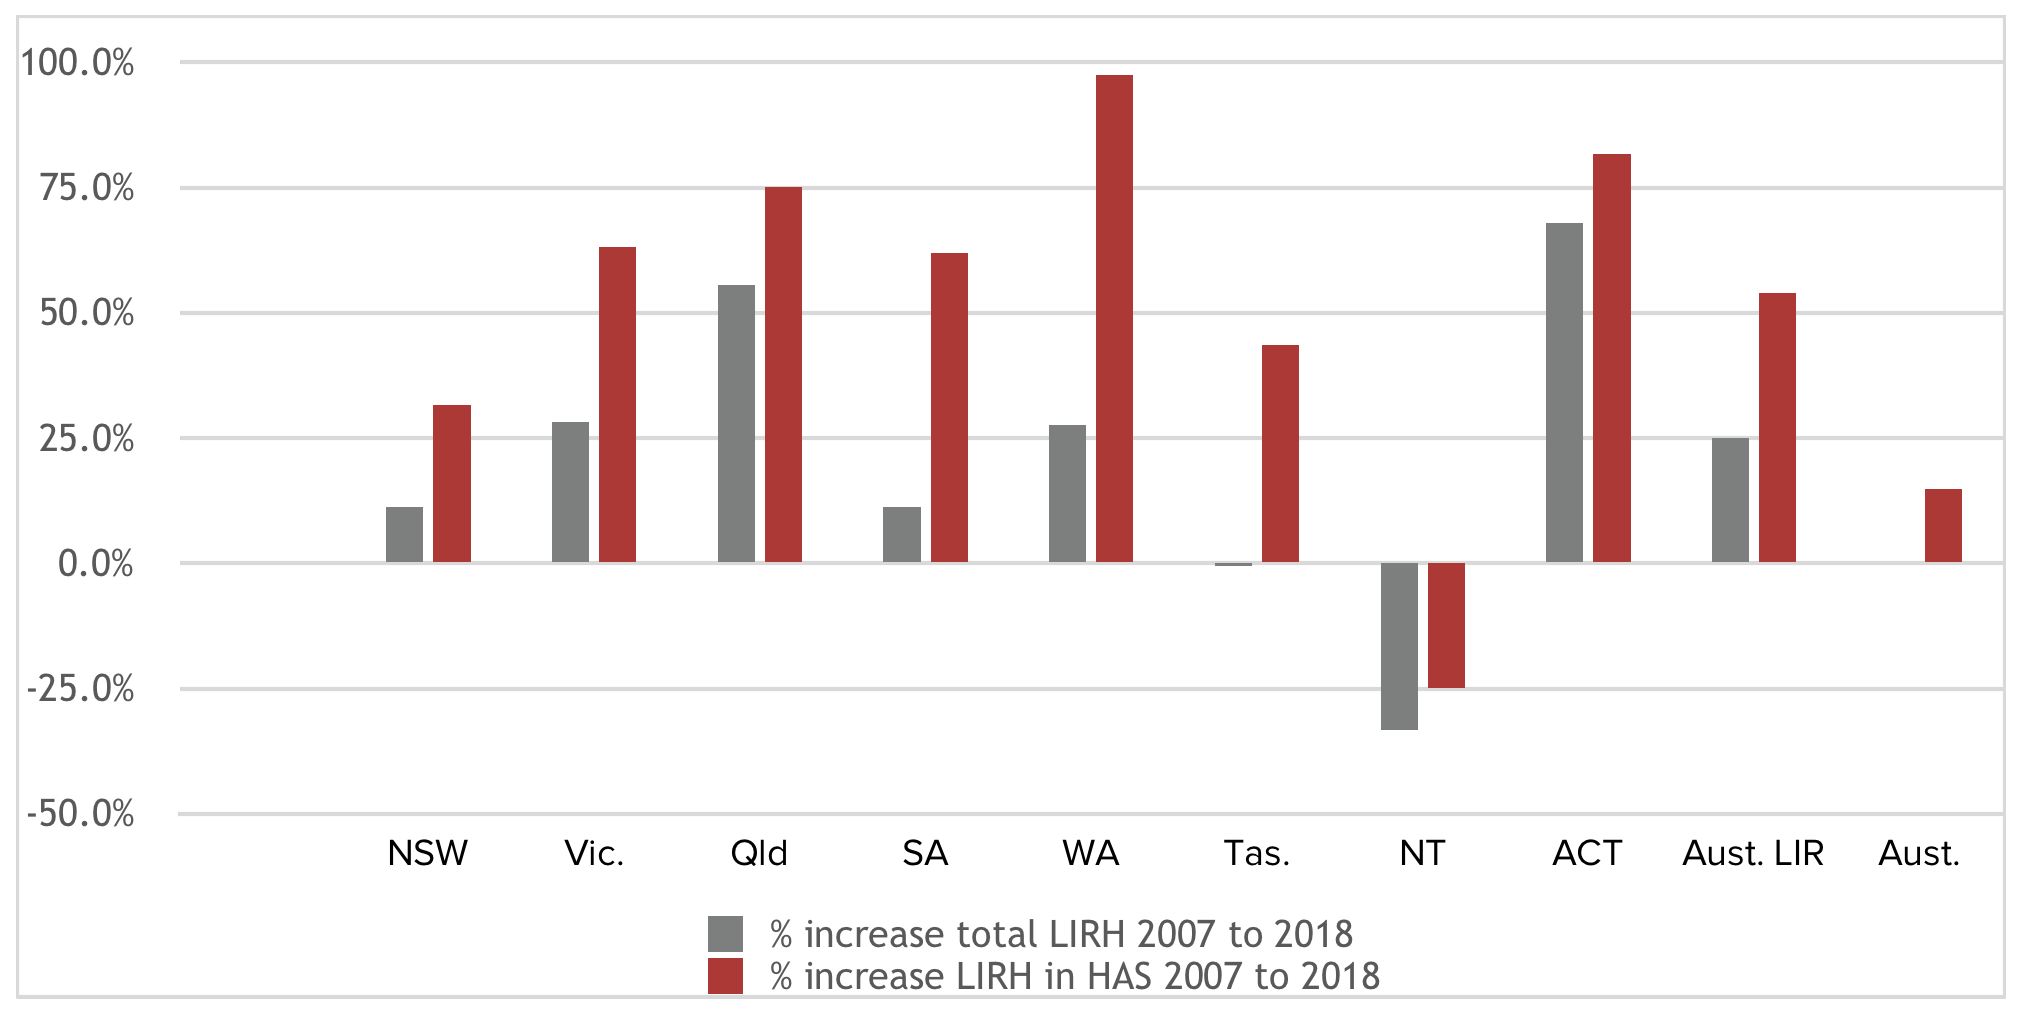
Source: ABS 4130.0, Housing Occupancy and Costs 2017–18. Table 21.1, Table 1.3, Table 13.3, Table 14.3, Table 15.3, Table 16.3, Table 17.3, Table 18.3, Table 19.3 and Table 20.3.
In Victoria, Queensland, Western Australia and the ACT the increase in the number of LIRHs has been above the increase in LIRHs for all Australia, with the increases in Queensland and ACT being very dramatic at 55.6 per cent and 68 per cent respectively. All four states/territory recorded population increases greater than the Australian average; three of the four recorded an increase in the growth of all households greater than the Australian average; and they all recorded higher than Australian average increases for LIRHs who are in HAS.
It is likely that for Victoria, Queensland, Western Australia and the ACT increases in overall population and LIRHs, together with the very small number of lower priced properties being built (between 2005 and 2014 only 6.7% of all houses and 3.4% of all units built were in the bottom 40% of house prices FR281p17 across Australia), has led to increased competition for affordable rental properties, resulting in an increase in households experiencing HAS.
Over the time period 2007 to 2018, NSW and South Australia recorded LIRH increases that were less than half the rate for Australia, and both jurisdictions recorded increases in households experiencing HAS, albeit that the NSW rate was below the Australian average.
In the Northern Territory the total numbers of LIRHs and households experiencing HAS both fell even though the overall population increased.
The situation in Tasmania is different to the other states and territories, with a reduction in the number of LIRHs and a 43.6 per cent increase in the number of LIRHs experiencing HAS than was the case 10 years earlier.