
In the 40 years between 1981 and 2021 the percentage of all Australian households living in social housing (i.e. state owned and managed public housing or community managed housing) has ranged from 4.9 per cent in 1981 to 3.8 per cent in 2021 (from 2021 ABS Census). Such a drop in the proportion of social housing raises the question of has Australia achieved the balance right, and also just what is the right level of social housing for Australia?
Table 1: Public and Community housing stock, Australia, 1981 and 2021
| Social housing dwellings | All Australian | % Social Housing | |
|---|---|---|---|
| 1981 | 228,938 dwellings | 4,668,906 dwellings | 4.9% |
| 2021 | 351,017 | 9,275,217 households | 3.8% |
Sources: AHURI Final Report No. 231 and ABS.
To put Australia's level of social housing into perspective, we can look at other countries with broadly similar cultural characteristics and values: England, New Zealand, Canada and the USA.
In 2018 Statistics Canada said 628,700 Canadian households, more than one in ten renter households nationally (13.5% of 4,652,500), were living in social and affordable housing. In 2021 the Canadian Census said there were 14,978,940 households, which means about 4.2 of all households were living in social housing.
In New Zealand, as of 30 June 2021, there were 74,337 public housing households. With a total estimate of 1,865,300 households in March 2021 for the country, this equates to 4.0% of households living in social housing.
In England (in 2018) 17% of households (3.9 million) lived in social housing, while the U.S. Department of Housing and Urban Development publishes that 1.2 million households live in public housing, which is 0.98 per cent of all housing (122,354,219 households in 2020).
As can be seen, there is a very wide spread of levels of social housing across these countries that culturally similar to Australia.
Comparing to EU countries
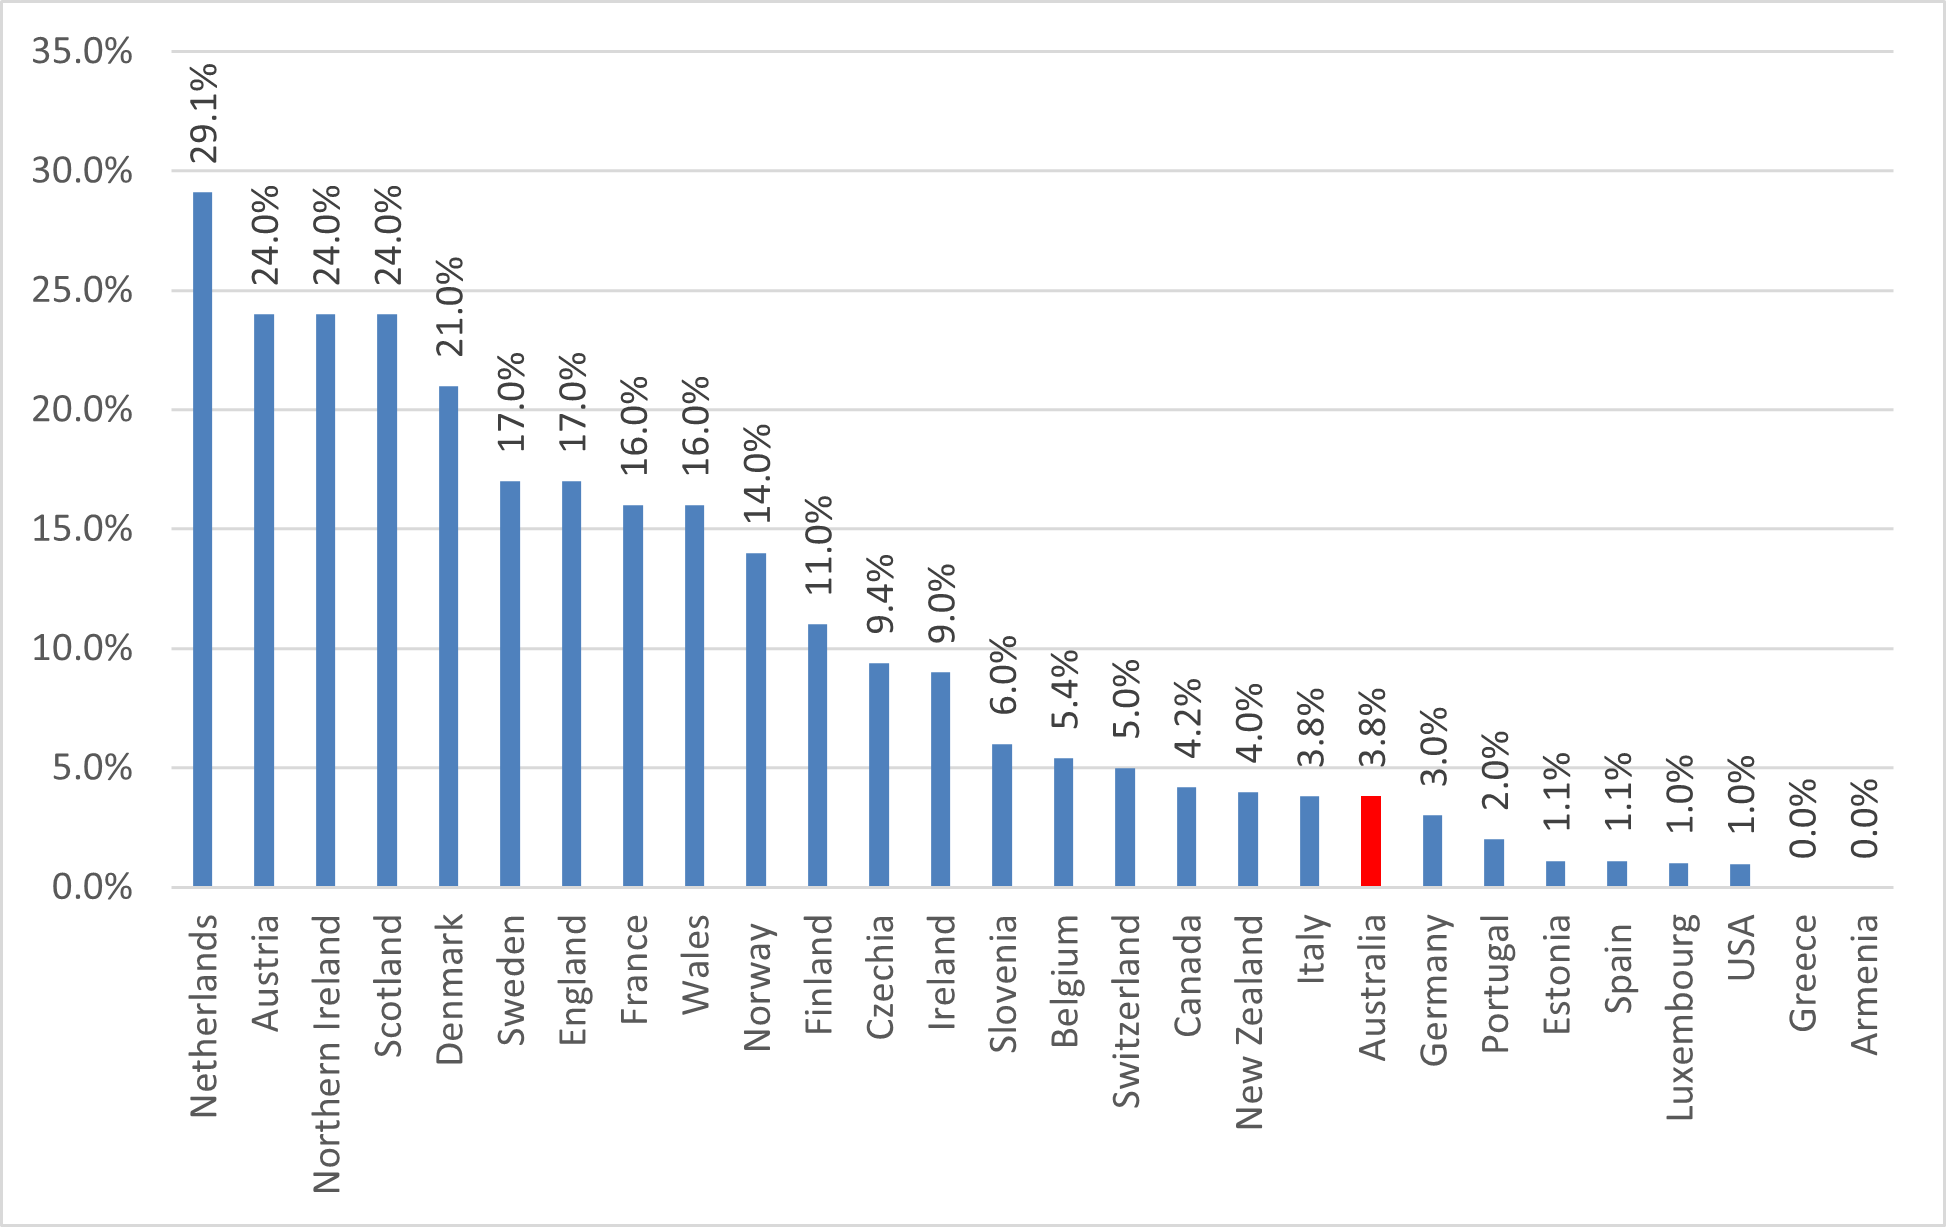
If we look further to 17 countries of the European Union (EU) plus three more, we also see a wide range of levels of social housing, from a low of 0 per cent in both Greece and Armenia, to a high of 29.1 per cent in The Netherlands.
However, when the 17 EU countries are ranked by percentage of social housing, we see the median lies with Slovenia (6%). Australia (3.8%) sits below the EU median average. The four highest results from the EU were Netherlands (29.1%), Austria (24%), Denmark (21%) and Sweden (17%) (note that the UK is no longer a member of the EU).
Figure 1: : Ranking highest to lowest % of social housing in the European Union and three other European countries, the UK, Australia, New Zealand, Canada and United States (2016–2020)
Comparing using GDP per capita
Perhaps looking at a country's wealth might provide an answer as to what is an appropriate level of social housing.
An examination of the 'GDP per capita' (i.e. the country's gross domestic product divided by its population) ranking of the selected countries, shows that, in 2021 (the latest available data), both Sweden and the Netherlands, with GDP per capita roughly comparable to Australia, had levels of social housing that were 4.5 to 7.6 times greater than for Australia.
Table 2: Europe, UK, Canada, USA, Australia ranked by per capita GDP 2021
|
|
||
|---|---|---|
|
Luxembourg |
$135,682.79 |
1% |
|
Ireland |
$99,152.10 |
9% |
|
Switzerland |
$93,457.44 |
5% |
|
Norway |
$89,202.75 |
14% |
|
United States |
$69,287.54 |
1% |
|
Denmark |
$67,803.05 |
21% |
|
Sweden |
$60,238.99 |
17% |
|
Australia |
$59,934.13 |
3.8% |
|
Netherlands |
$58,061.00 |
29.1% |
|
Finland |
$53,982.61 |
11% |
|
Austria |
$53,267.93 |
24% |
|
Canada |
$52,051.35 |
4.2% |
|
Belgium |
$51,767.79 |
5.4% |
|
Germany |
$50,801.79 |
3% |
|
New Zealand |
$48,801.69 |
4% |
|
United Kingdom |
$47,334.36 |
England 17%; Nth Ireland 24%; Scotland 24%; Wales 16% |
|
France |
$43,518.54 |
16% |
|
Italy |
$35,551.28 |
3.8% |
|
Spain |
$30,115.71 |
1.1% |
|
Slovenia |
$29,200.82 |
6% |
|
Estonia |
$27,280.66 |
1.1% |
|
Czechia (Czech Republic) |
$26,378.50 |
9.4% |
|
Portugal |
$24,262.18 |
2% |
|
Greece |
$20,276.54 |
0% |
|
Armenia |
$4,670.01 |
0% |