This is the last in a series of three AHURI Briefs that examines Census data to understand how homelessness is changing in Australia. Read the first and second Brief here.
Across the categories of homelessness, rough sleeping often receives the most most media attention due to its public and confronting nature. Sleeping rough is defined by the ABS as living in improvised dwellings, tents, or sleeping out. As a category of homelessness, it recorded the second largest increase in the 2016 Census (after people in severely overcrowded housing).
Between 2011 and 2016, NSW had the largest number of people sleeping rough, with 2,588 individuals recorded, a 34.7 per cent increase (equating to 666 individuals), while the ACT recorded the biggest percentage rise in rough sleepers with a 74.2 per cent increase to encompass 54 individuals in total.
| Number in 2016 | Number change since 2011 | Percentage change since 2011 | |
|---|---|---|---|
| New South Wales | 2,588 | 666 | 34.7% |
| Victoria | 1,123 | 32 | 2.9% |
| Queensland | 1,736 | 156 | 9.9% |
| South Australia | 387 | 131 | 51.2% |
| Western Australia | 1,083 | 156 | 16.8% |
| Tasmania | 139 | -18 | 11.5% |
| Northern Territory | 1,097 | 250 | 29.5% |
| Australian Capital Territory | 54 | 23 | 74.2% |
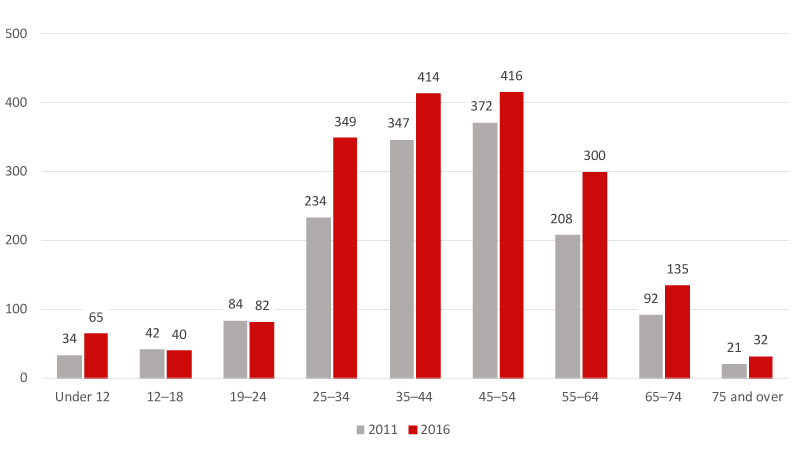
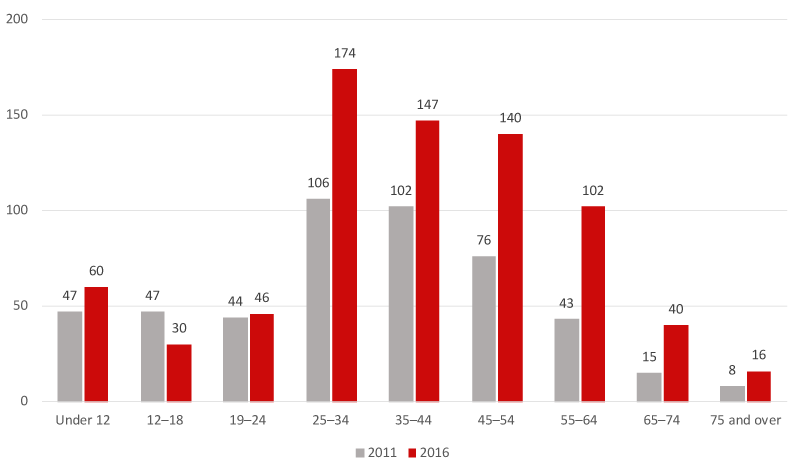
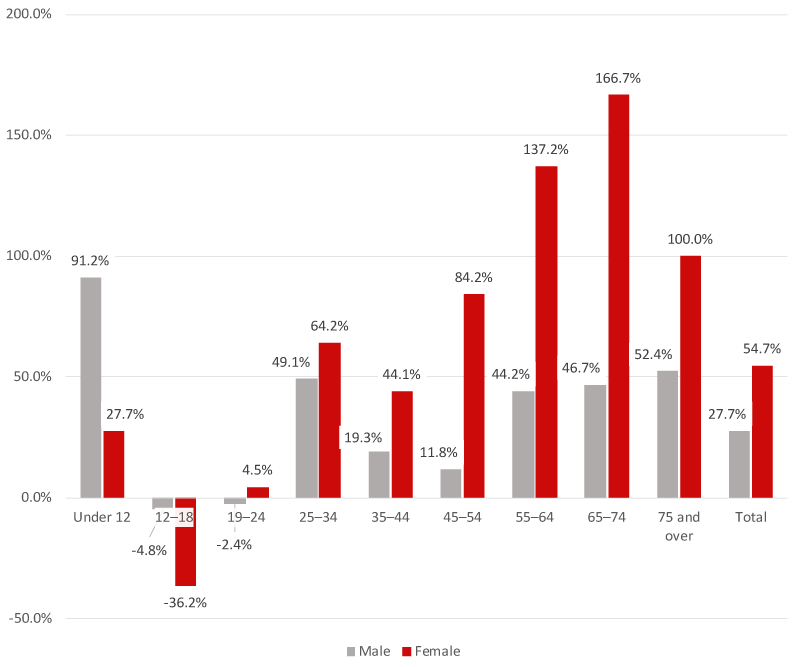
If we take a closer look at the data for NSW (as it had the greatest number of new rough sleepers of all states and territories) we find that there has been a 54.7 per cent increase in the total number of female rough sleepers (total of 755 females in 2016) and a 27.7 per cent increase in the total number of male rough sleepers (total of 1,831 males in 2016). Although male rough sleepers out number females 2.4 to 1, the greatest increase in rough sleepers between 2011 and 2016 in NSW has been for women aged 65 to 74, with a 166.7 per cent increase.
Figure 1: Number of male rough sleepers in NSW by age bracket, 2011 and 2016

Figure 2: Number of female rough sleepers in NSW by age bracket, 2011 and 2016

Figure 3: Rate of change for male and female rough sleepers in NSW by age bracket, 2011 to 2016


