This is the second of three AHURI Briefs that examines Census data to understand how homelessness is changing in Australia. Read the first and third Brief here.
The 2016 Census shows that the greatest number and percentage increases in homelessness between 2011 and 2016 occurred in NSW.
Table 1: Change in homeless by state/territory 2011 to 2016
| Number in 2016 | Number change since 2011 | Percentage change since 2011 | |
|---|---|---|---|
| New South Wales |
37,715 |
10,236 |
37.3% |
| Victoria | 24,817 | 2,511 | 11.3% |
| Queensland | 21,671 | 2,632 | 13.8% |
| South Australia | 6,224 | 408 | 7.0% |
| Western Australia | 9,005 | -186 | -2.0% |
| Tasmania | 1.622 | 85 | 5.5% |
| Northern Territory | 13,717 | -1,613 | -10.5% |
| Australian Capital Territory | 1,596 | -142 | -8.2% |
Source: ABS Census of Population and Housing: Estimating homelessness, 2016
Large increase in people living in severely crowded dwellings
Looking at the categories of homelessness in NSW from 2011–16, we find the largest increase of 72.4 per cent was for those living in 'severely' crowded dwellings, from 9,655 people in 2011 to 16,821—an increase of 7,166. The ABS defines a severely overcrowded home as needing four or more extra bedrooms to house the occupants of the dwelling.
The largest increase in the severely crowded dwelling category in NSW is for males aged 35–44 and males aged 65–74, who both recorded a very large 180 per cent increase in numbers between 2011 and 2016. The number of males living in a severely overcrowded home aged 35–44 rose from 366 individuals in 2011 to 1,026 in 2016, and from 66 individuals to 185 for males aged 65–74.
The largest number of people of any age group living in a severely overcrowded home in NSW in 2016 were 2,920 males aged 25–34 closely followed by 2,315 males aged 19–24. In addition there were 1,803 females aged 25–34 and 1,613 females aged 19–24 living in NSW who also experienced severe crowding. These four groups from NSW recorded the largest numbers of individuals by age group experiencing homelessness due to living in a severely overcrowded home for all states and territories in Australia.
Figure 1: Number of males in NSW living in severely crowded dwellings by age bracket, 2011 and 2016
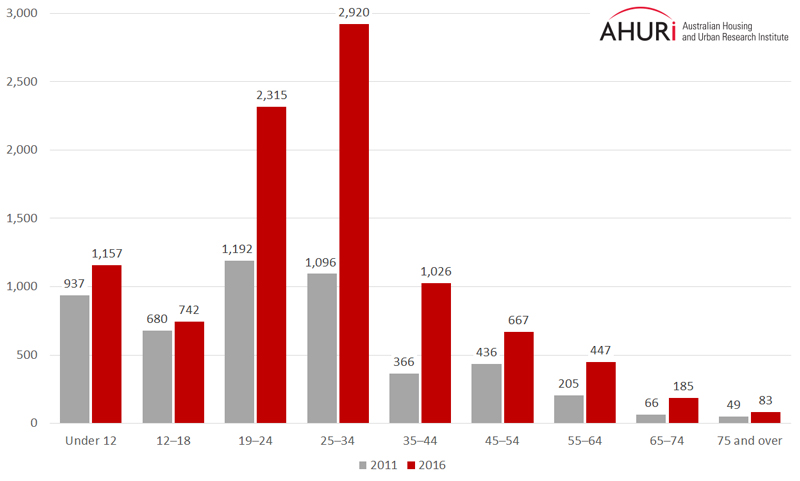
Sources: ABS Census of Population and Housing: Estimating homelessness, 2016., ABS Census of Population and Housing: Estimating homelessness, 2011
Figure 2: Number of females in NSW living in severely crowded dwellings by age bracket, 2011 and 2016
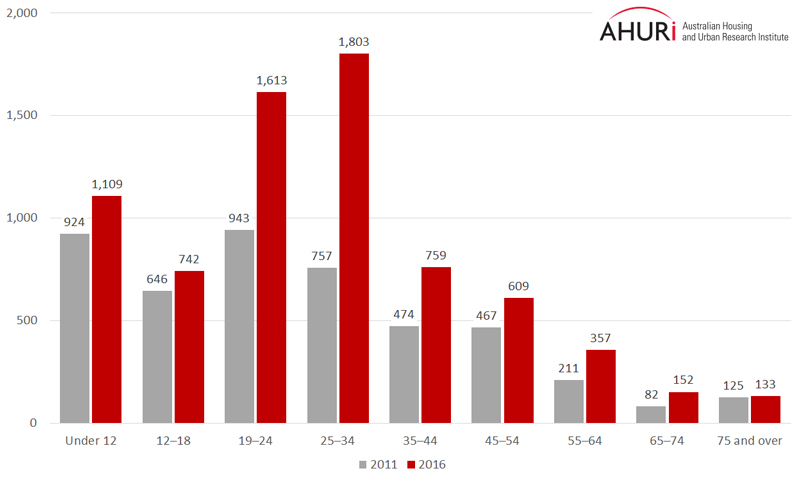
Sources: ABS Census of Population and Housing: Estimating homelessness, 2016., ABS Census of Population and Housing: Estimating homelessness, 2011