
Social housing as a percentage of all housing falls to 3.8 per cent
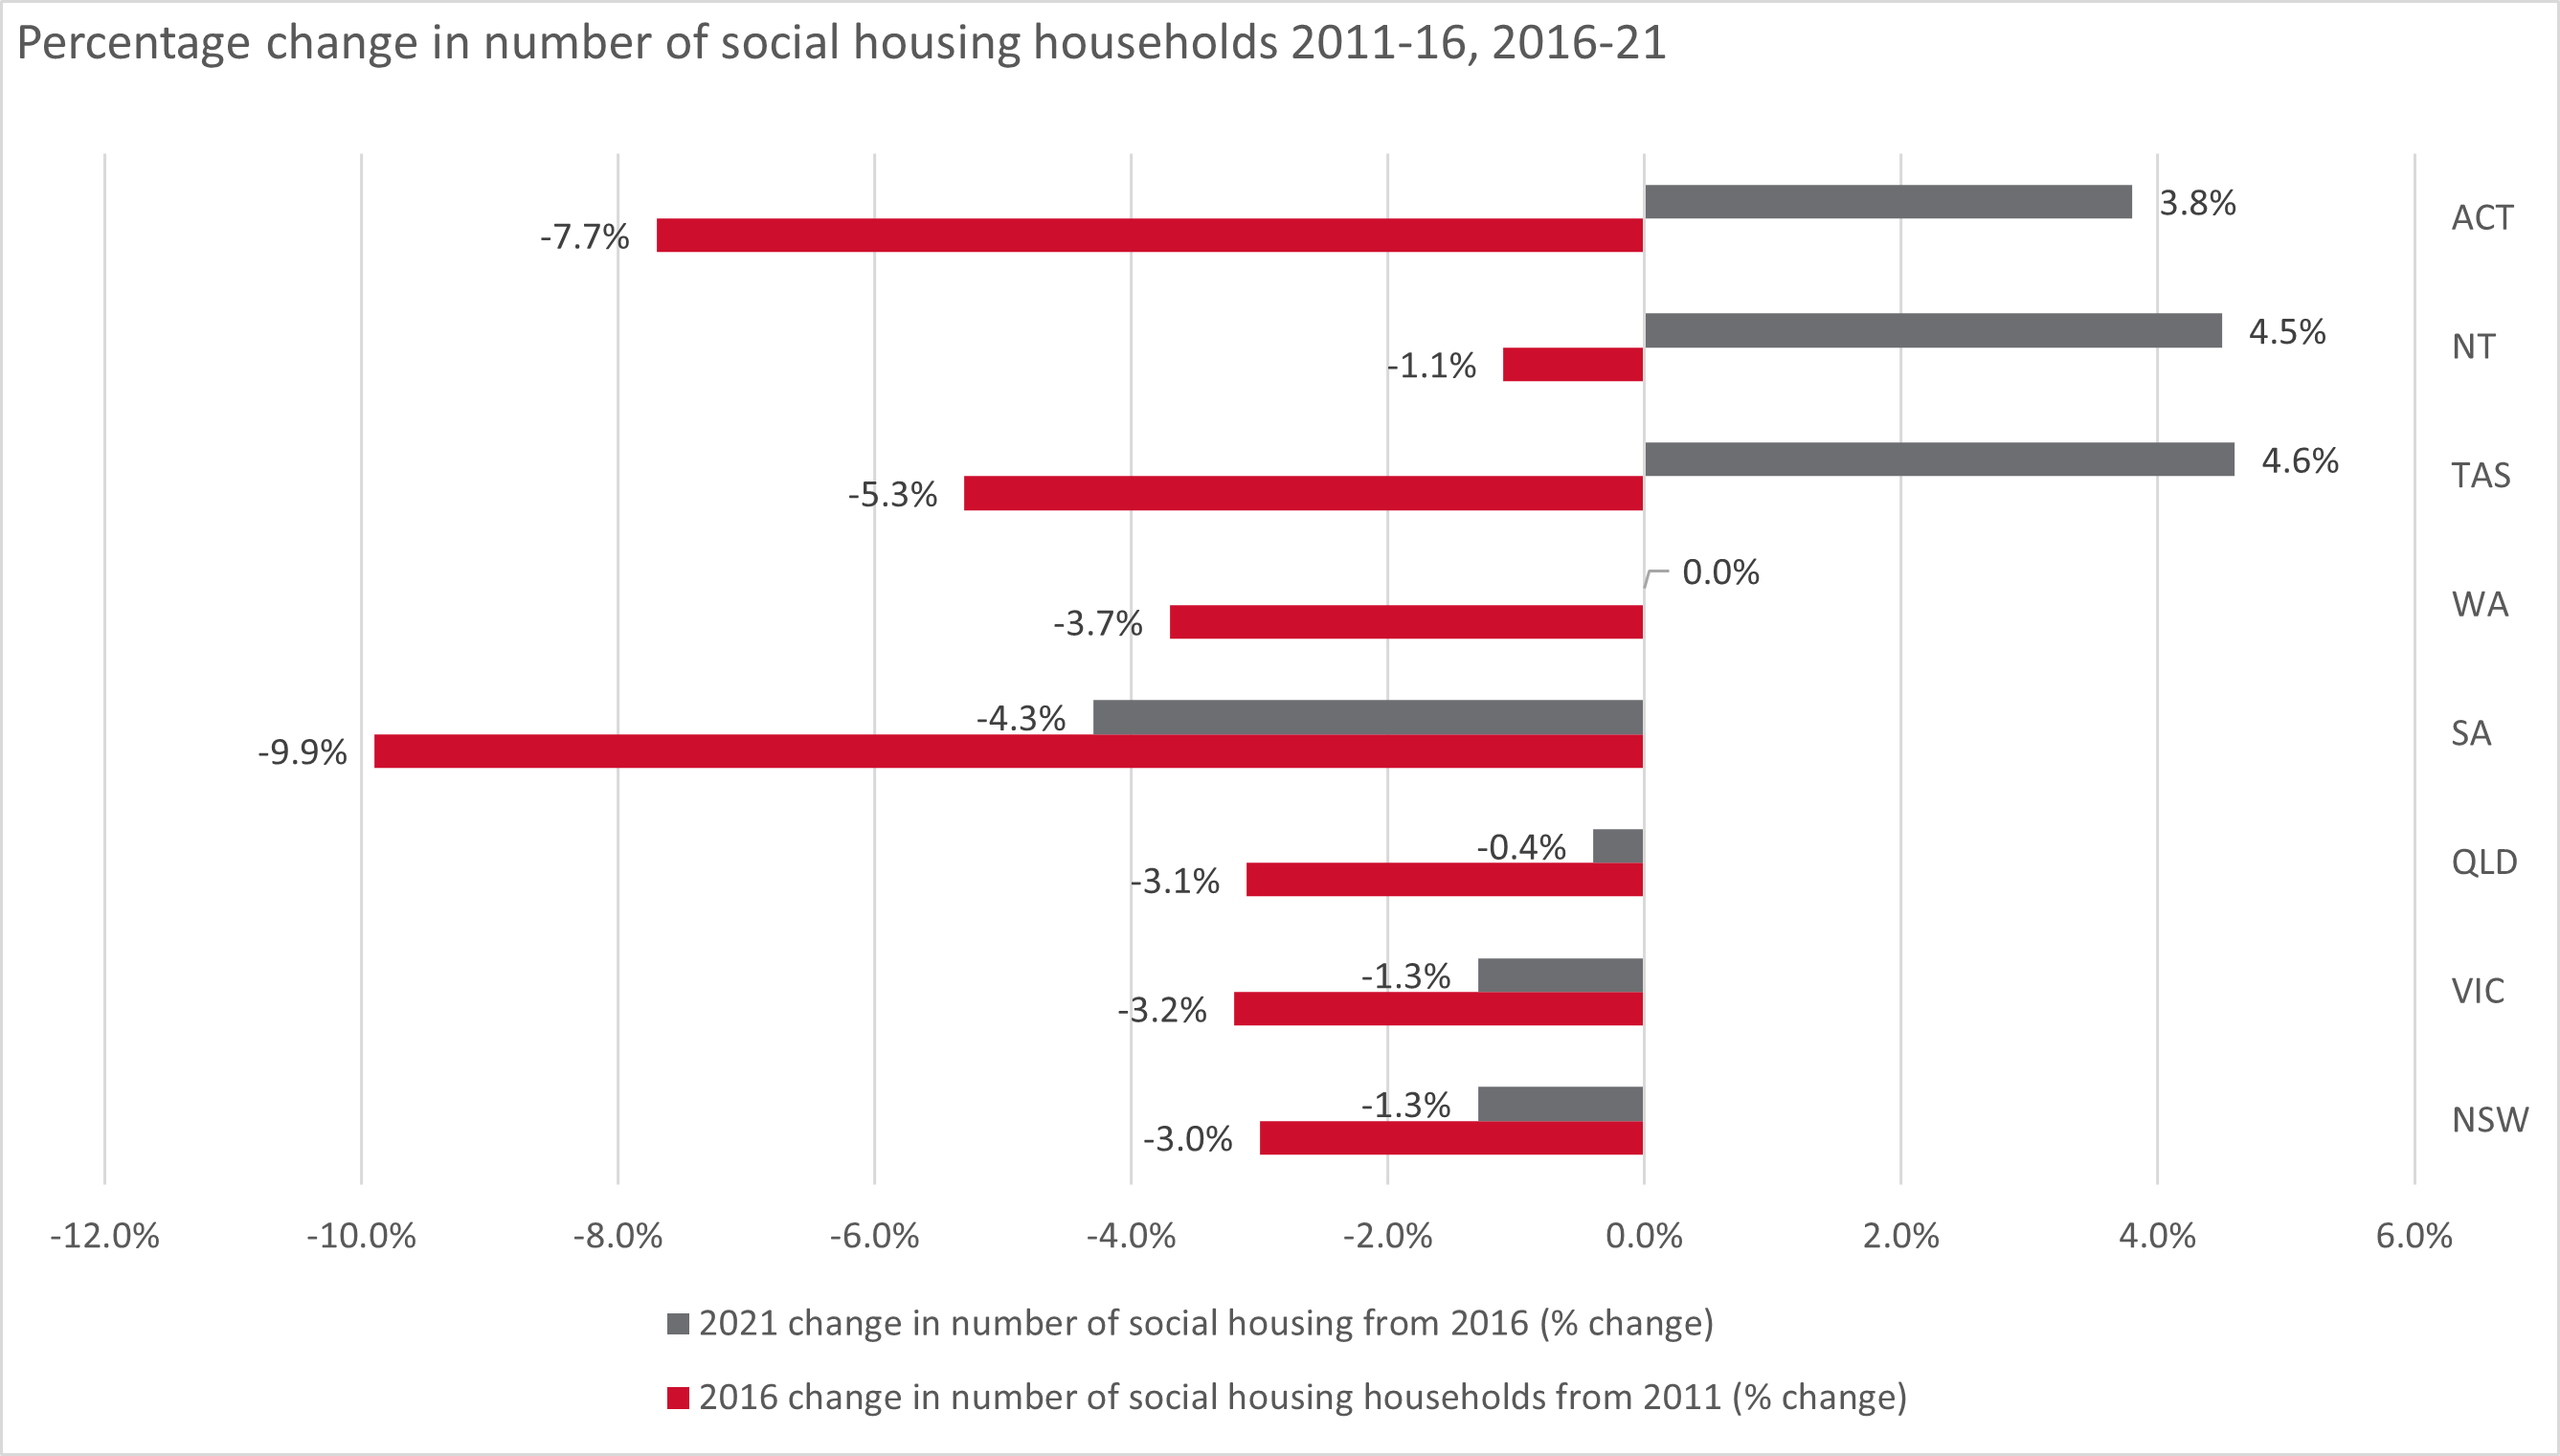
The release of the 2021 ABS Census data shows that the number of social housing households (which includes both public housing and community housing) fell between 2011 and 2021 across Australia except in the Northern Territory, which had a 3.3% increase over that time period. While Tasmania recorded a 5.3 per cent fall between 2011 and 2016, it turned this around to show an increase of 4.6 per cent between 2016 and 2021.
When looking at the declines in social housing between 2011 to 2016 and 2016 to 2021 we see that the fall in social housing numbers has slowed down. For example, across Australia there was 4.1 per cent fall in numbers of social housing dwelling between 2011 and 2016 but only a 0.9 per cent fall between 2016 and 2021.
Figure 1: Percentage change in number of social housing households 2011-16, 2016-21
Source: ABS Census 2011, 2016 and 2021
When looking at changes in public housing and community housing between 2016 and 2021 we see that Australia recorded a drop in the number of public housing households and an increase in the number of community housing households. In part, the increase in community housing households is due to community housing providers (CHPs) both building or buying more dwellings and the transfer of public housing stock from state/territory government housing authorities to CHPs.
Nevertheless, the welcome increases in community housing dwellings are not enough to offset overall social housing loses and are insufficient in light of the increases in Australia’s population (8.6%) and households (11.9%) between 2016 and 2021. In addition, the total number of social housing households was recorded as being lower in 2021 (348,018 households) than in 2011 (366,063 households).
Australia's social housing compared to other nations is explored in our AHURI Brief - What is the right level of social housing for Australia?