There has been discussion in the media about the challenges facing Australia's growing cities and debate about the impact overseas migration is having on the demand for housing, transport, infrastructure and services. Just how many people are migrating to Australia, which regions are drawing the most migrants and how does this compare with the longer-term trend?
How many people are migrating to Australia?
In 2018, 63,680 people arrived in Australia on a permanent visa (i.e. Family, Skill, Special Eligibility and humanitarian visas) while another 192,940 arrived on a form of temporary visa (i.e. Vocational Education and Training sector, Higher education sector, Student other, Temporary work skilled (subclass 457), Visitor, Working Holiday and Other temporary visas).
The majority of those on temporary visas (109,320 or 56.7% of all temporary visa migrants) were students in the Vocational Education and Training sector, Higher education sector and other Student category.
In addition nearly 9,000 New Zealand citizens exercised their right to live in Australia, while over 10,000 Australians left the country. As a consequence, Australia’s population increased by around 248,440 people due to overseas migration in 2018.
Table 1: Australia international migration patterns, 2018
| Overseas migrants arriving on ... | |
|---|---|
| Permanent visa | 63,680 |
| Temporary visa (including students) | 192,940 |
| Total | 256,620 |
| Other categories of overseas migrants | |
| New Zealand citizens | 8,960 |
| Australian citizens | (10,170) |
| Other visa arrangement | (6,959) |
| Total | 248,440 |
Source: ABS 3412.0 Net overseas migration, Australia 2018. Table 1.15.
Where in Australia are they migrating to?
However, the number of migrants attracted to each Australian state and territory varies considerably, as does the proportion of each state or territory that increased its population due to new overseas arrivals.
The majority of overseas migrants settled in NSW (37% of overseas migrants) and Victoria (34.6% of overseas migrants), while the highest rate of increase of population due to new migrants was in Victoria, where 1.32 per cent of the population were recent overseas migrants in 2018.
Table 2: Population increase due Overseas migration, 2018
| Net overseas migration | Proportion of overseas migrants to each state/territory | State/territory population (Dec 2018) | Proportion of state/territory population that were recent overseas migrants | |
|---|---|---|---|---|
| New South Wales | 92,000 | 37.03% | 8,046,100 | 1.14% |
| Victoria | 85,960 | 34.60% | 6,526,400 | 1.32% |
| Queensland | 35,040 | 14.10% | 5,052,800 | 0.69% |
| South Australia | 13,320 | 5.36% | 1,742,700 | 0.76% |
| Western Australia | 14,860 | 5.98% | 2,606,300 | 0.57% |
| Tasmania | 2,720 | 1.09% | 532,500 | 0.51% |
| Northern Territory | 530 | 0.21% | 245,900 | 0.22% |
| Australian Capital Territory | 4,010 | 1.61% | 423,800 | 0.95% |
| Australia | 248,440 | 100% | 25,180,200 | 0.99% |
Source: ABS Migration, Australia 2017-18. Table 1.14 Net Overseas Migration 2017, and ABS 3101.0 Australian Demographic Statistics. Estimated Resident Population, States and Territories
Migration numbers over time
Over the period 2004 to 2018 the number of people migrating to Australia with a permanent visa each year has varied, with the greatest number (85,900 people) arriving in 2008 and the next highest peak, being 83,270 people, arriving in 2016. Approximately the same number of people arrived with a permanent visa in 2004 (61,330 people) as arrived in 2018 (63,680 people).
In contrast, the number of people arriving on a temporary visa has risen steadily since 2004, when 90,960 people arrived. In 2018, 192,940 people arrived on a temporary visa.
Figure 1: Net migration to Australia, 2004 to 2008
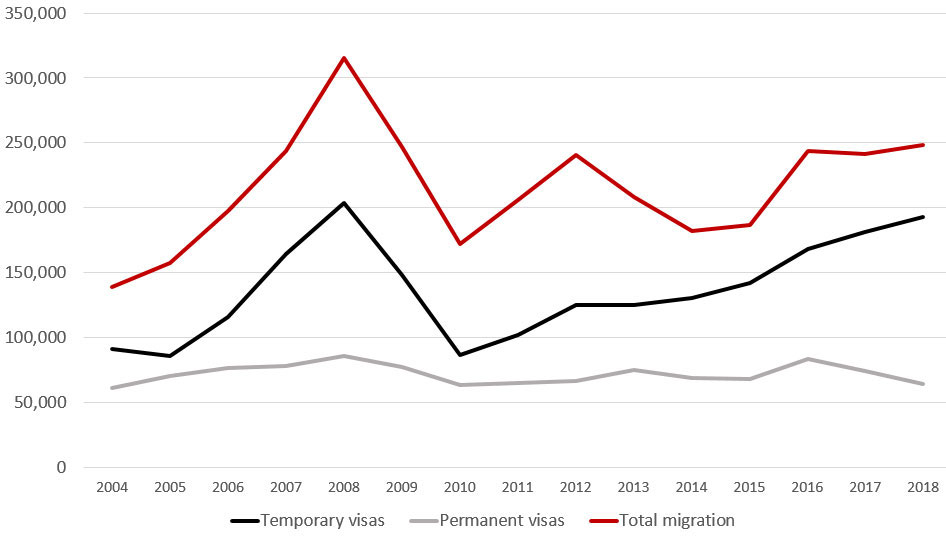
Source: ABS 3412.0 Net overseas migration, 2004 to 2018. Australia. Tables 1.1 to 1.15