The story of the 2021 ABS Census and the interplay between increases in population and numbers of households and increases in numbers of private dwellings between 2011, 2016 and 2021 is quite nuanced.
Population growth
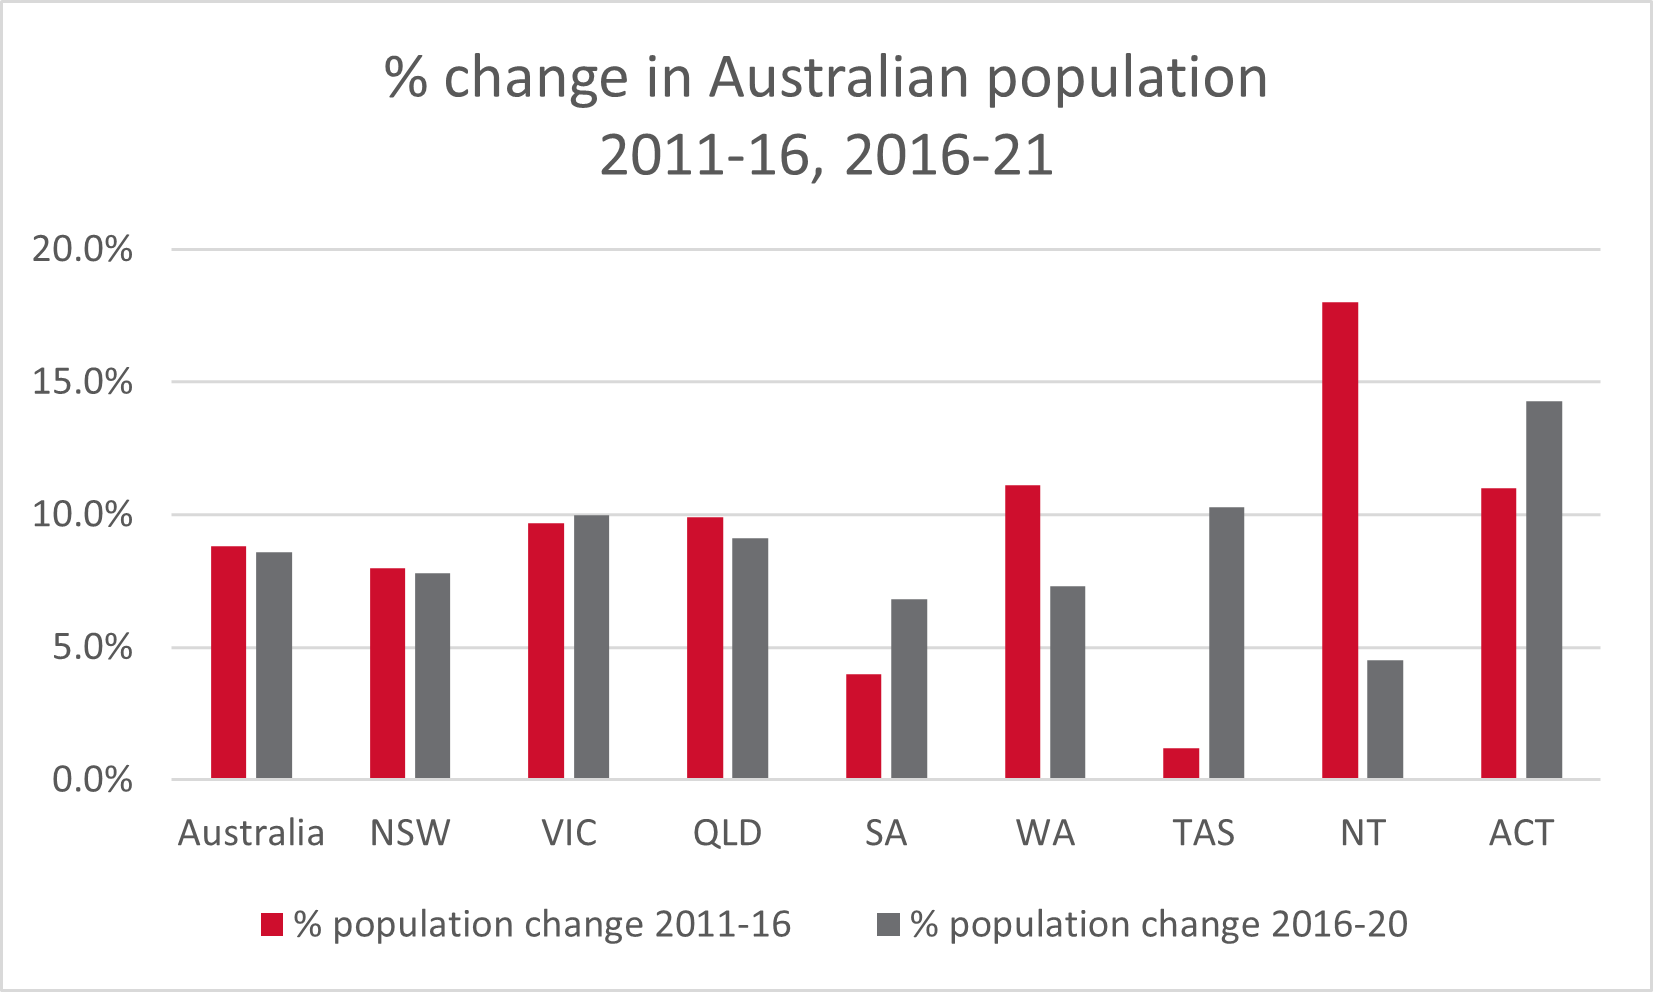
For Australia, the rate of population growth slowed slightly between 2016 and 2021 (8.6% growth) when compared with the rate of growth in the years 2011 to 2016 (8.8% growth). The rate of population growth slowed in NSW, Queensland, Western Australia and Northern Territory between 2016 and 2021 (compared to 2011 to 2016), with the Northern Territory recording a particularly significant slowdown from an 18 per cent increase in 2011–16 to 4.5 per cent in 2016–21.
In contrast, Victoria, South Australia, Tasmania and ACT all increased their rate of growth between 2016 and 2021. Tasmania’s rate of population growth of 10.3 per cent between 2016 and 2021 was significantly greater than the 1.2 per cent rate of growth recorded in the previous five years.
Figure 1: Percentage change in Australian population 2011-16, 2016-21
Household growth comparted to the number of homes
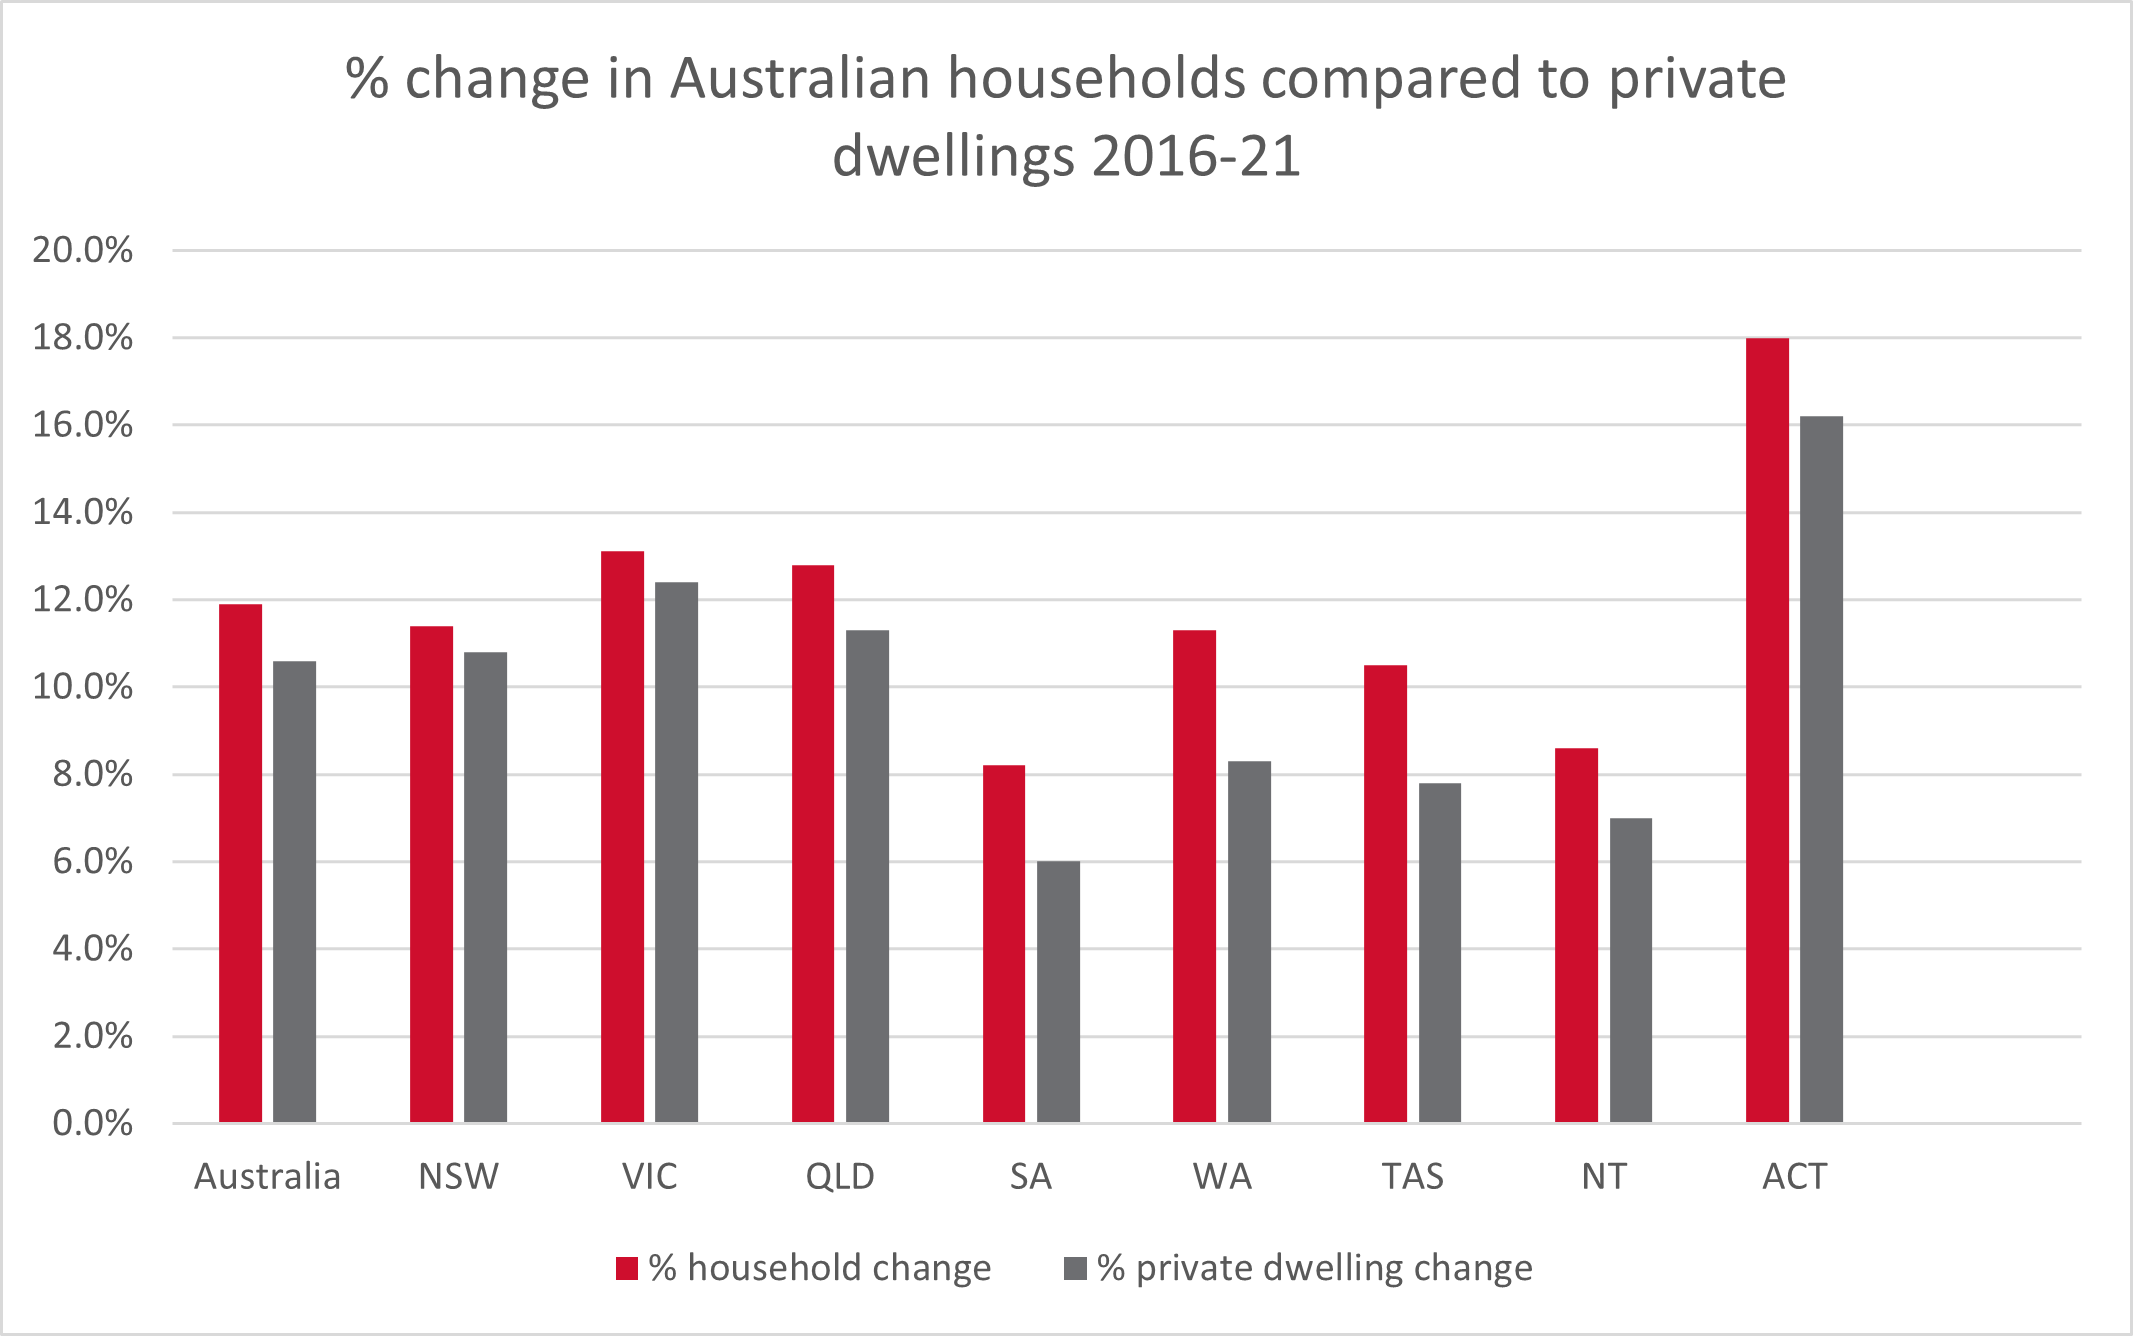
When we compare the growth in households with the growth in private dwellings (including unoccupied ones) we see that between 2016 and 2021 the rate of increase in the number of households rose faster than the rate of increase in the number of private dwellings in every state or territory in Australia. As new households have to live somewhere, (and there being no increase in the number of social housing dwellings over this time period) this suggests that, across the nation, the supply of new dwellings is not being delivered fast enough to properly provide enough homes for everyone.
In contrast the previous growth in the number of private dwellings between 2011 and 2016 was greater in every state or territory apart from Tasmania (which had a 2.5% increase in households and only a 2% increase in private dwellings).
Figure 2: Percentage change in Australian households compared to private dwellings, 2011-2016
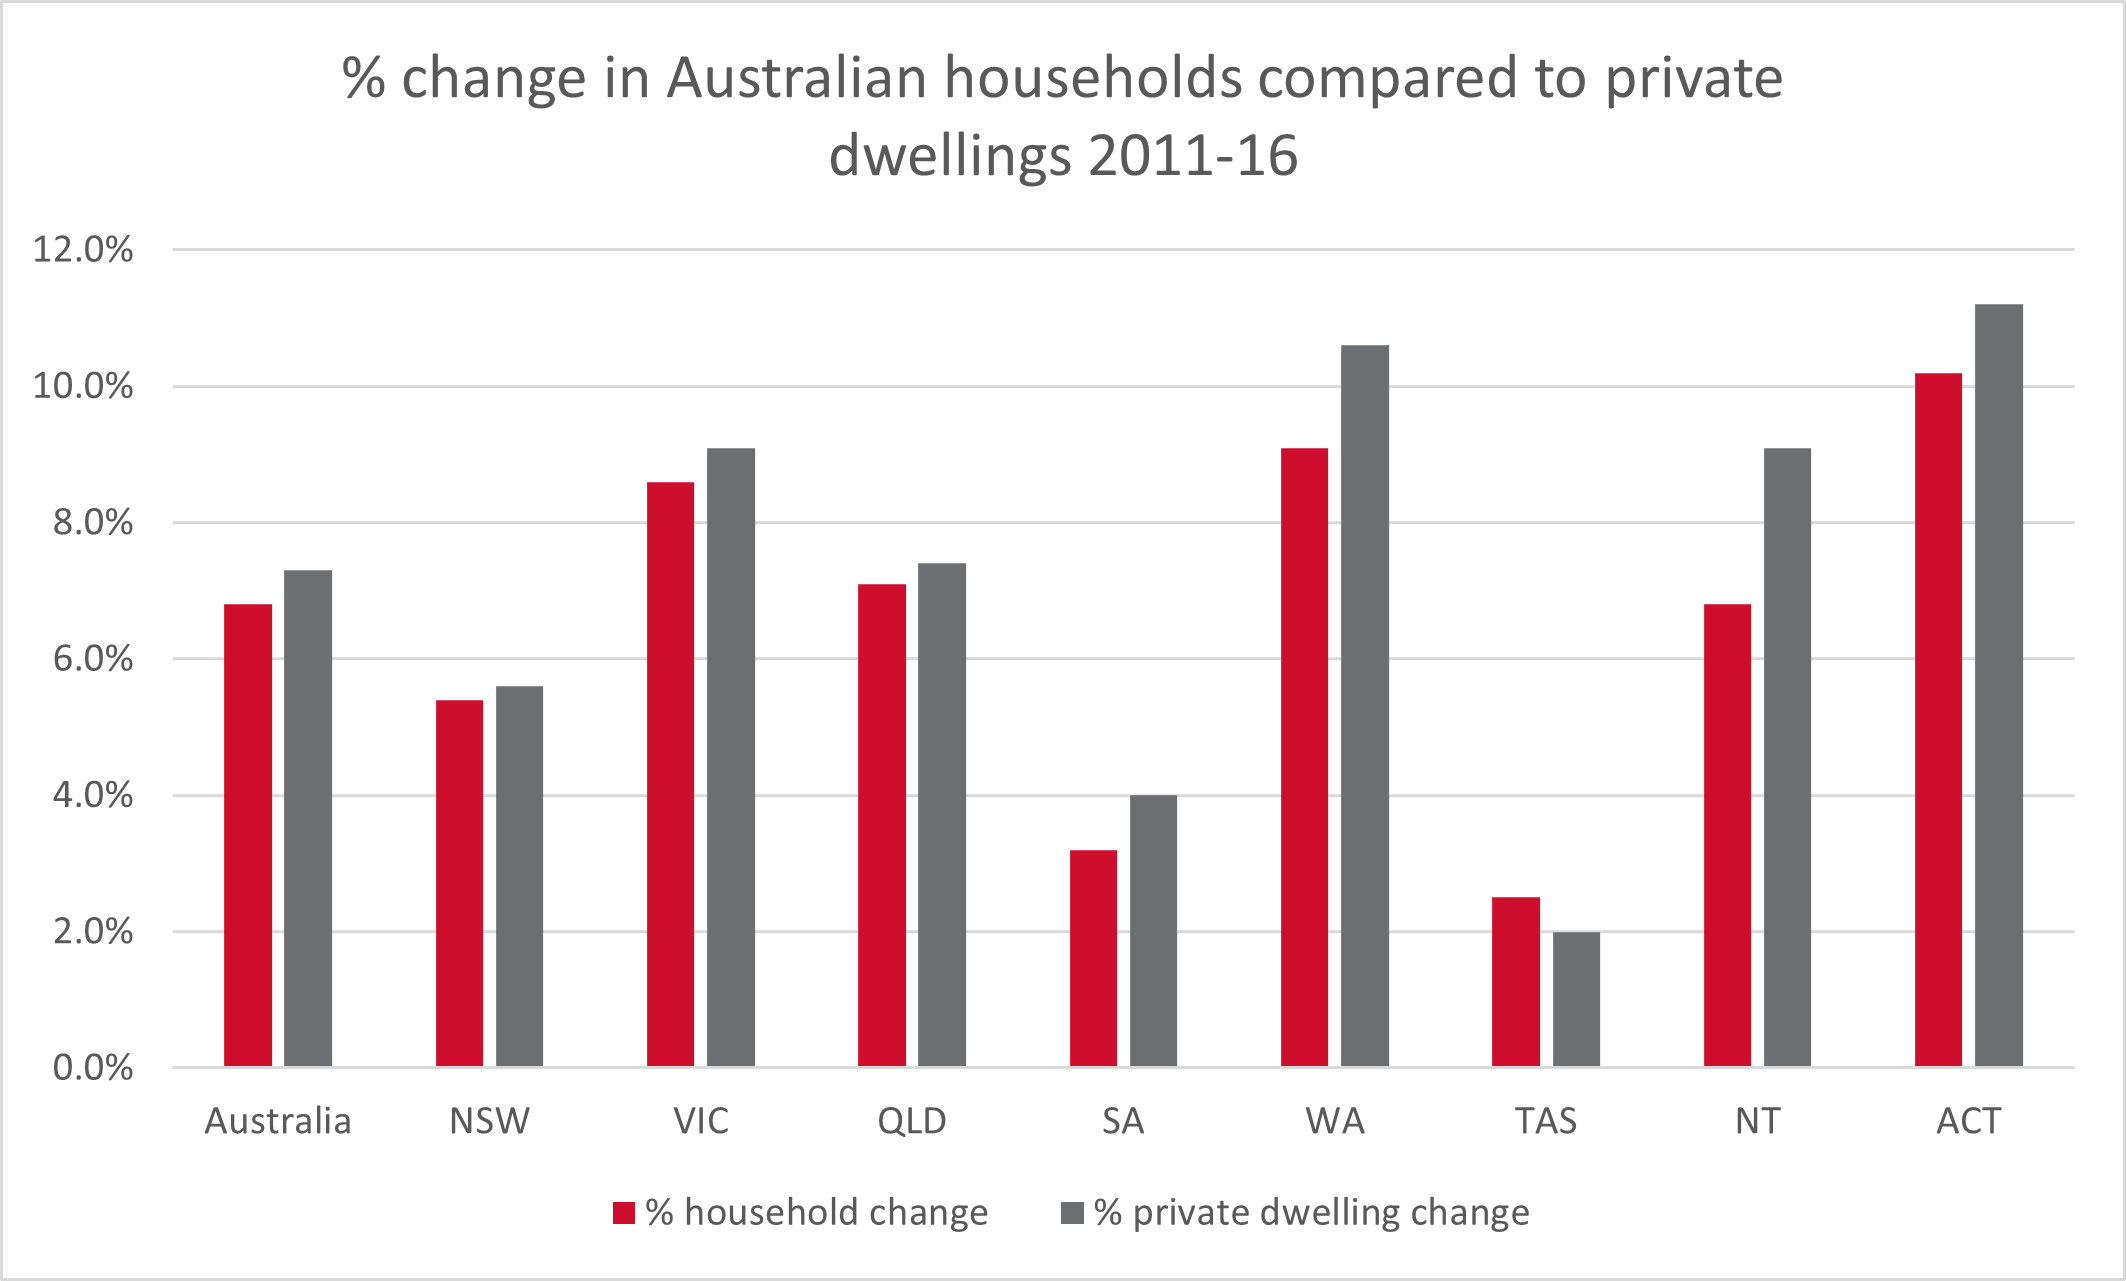
Figure 3: Percentage change in Australian households compared to private dwellings 2016-2021
What’s happening in our cities?
When we look at the increase in number of households and number of dwellings between 2016 and 2021 in Australia’s two biggest cities, Greater Sydney and Greater Melbourne, we see that housing supply increases were greater than new household formation, suggesting that, although there might still be localised supply issues in these cities, in general developers were building sufficient numbers of dwellings to house new households and residents.
In every other state/territory capital city the rate of increase of households and the increase in the actual number of households was greater than the increase in the number of private dwellings, suggesting new housing supply is not keeping up with the increase in the number of new households.
In particular, proportionally large increases in both population and households compared to lower rates of increases in new dwellings suggests that the lack of new housing supply is particularly prevalent in both South Australia and Tasmania (and their capital cities of Adelaide and Hobart).
Figure 4: Percentage change in households and private dwellings, Australian capital cities, 2016-21
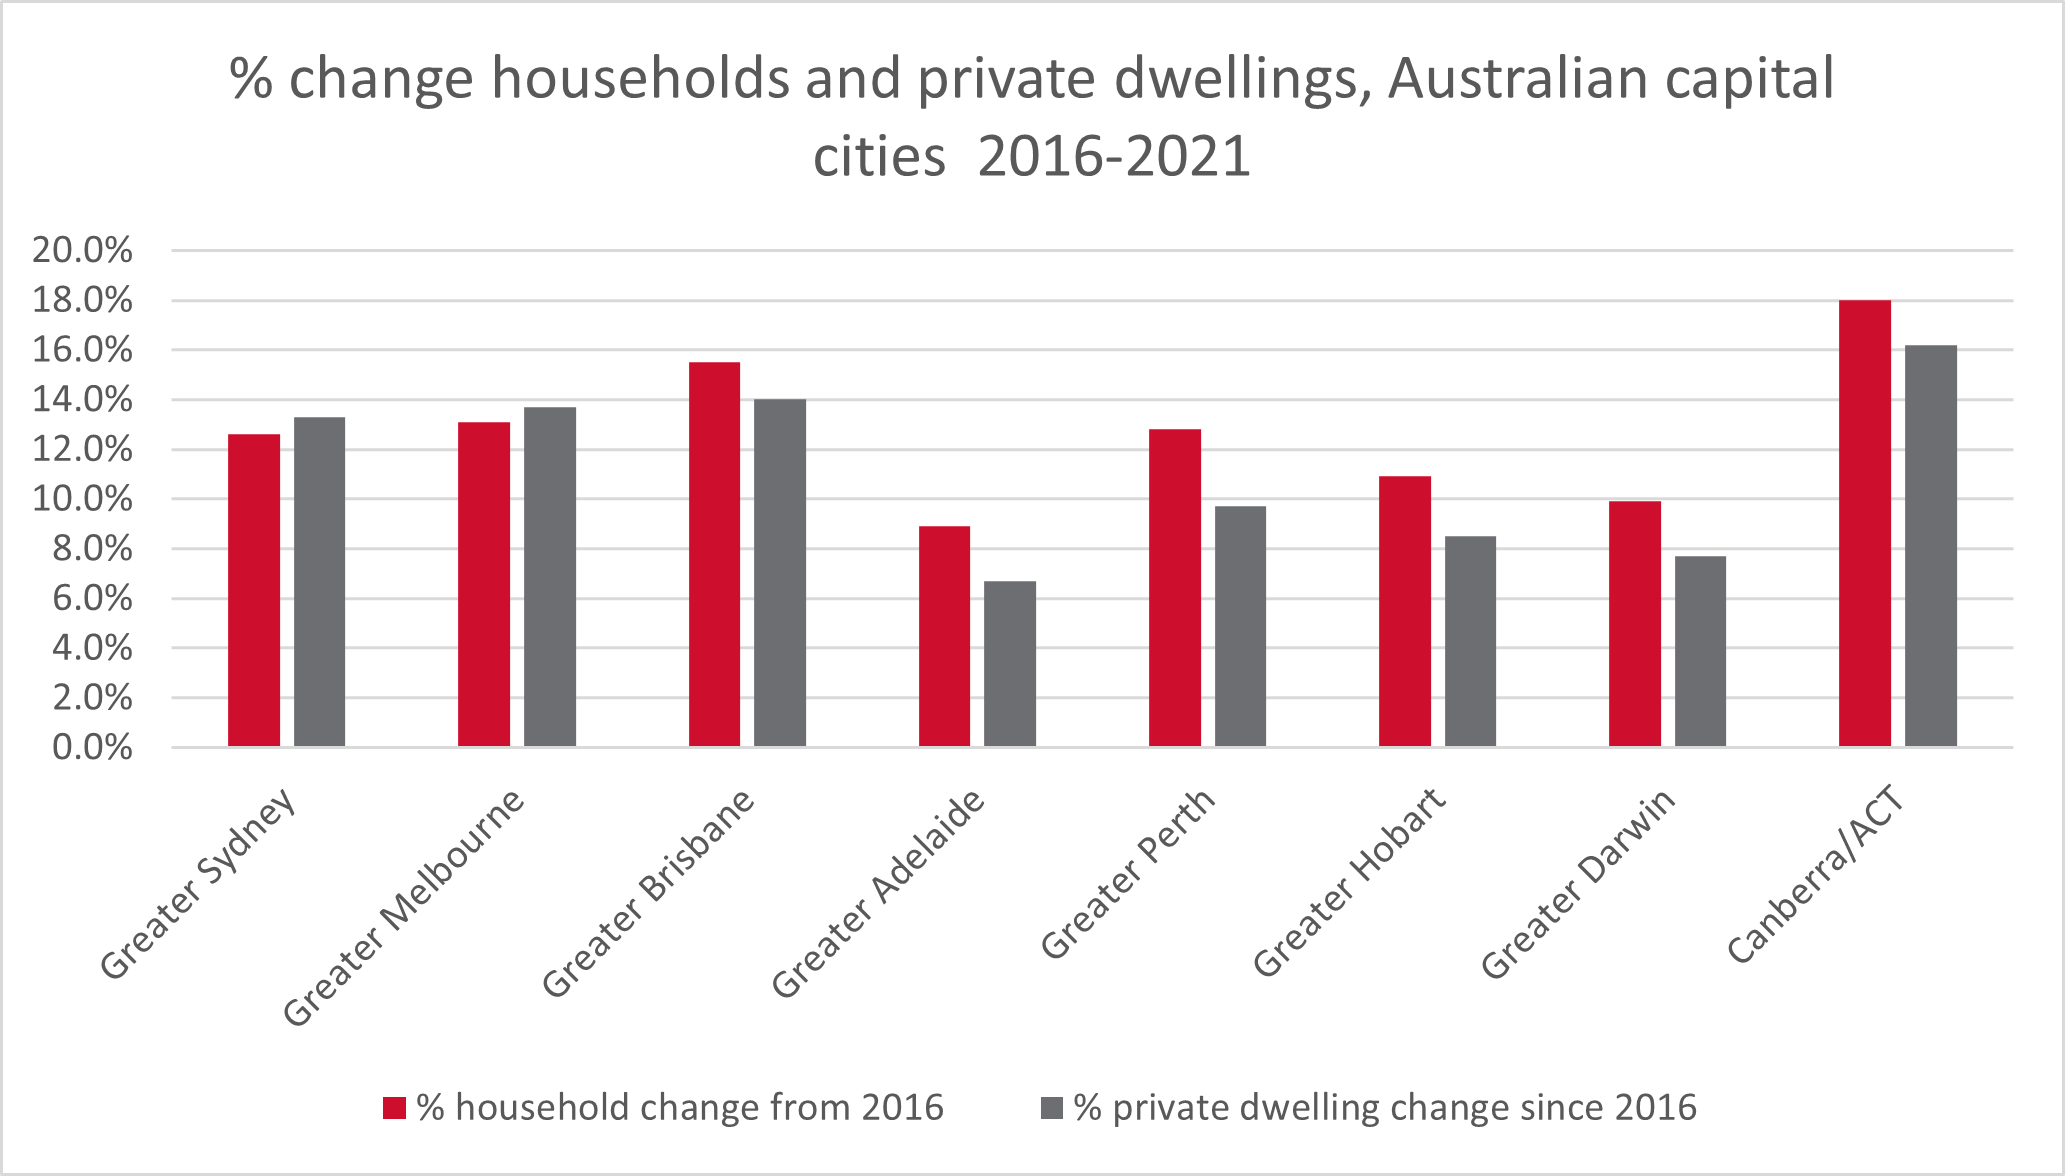
Of course, the 2021 Census is a snapshot taken during COVID-19 and the data in Melbourne and Sydney may reflect that, with COVID restrictions, the rate of increase in new households was suppressed in 2020 and 2021 due to people not migrating to these cities or people who were already there staying in their existing households and not forming new households (e.g. young adults staying in the family home and not moving out). Nevertheless, despite COVID restrictions the increase in new households in both Sydney (12.6%) and Melbourne (13.1%) was greater than the increase in households for all of Australia (11.9%) when looking at the five-year period 2016 to 2021.
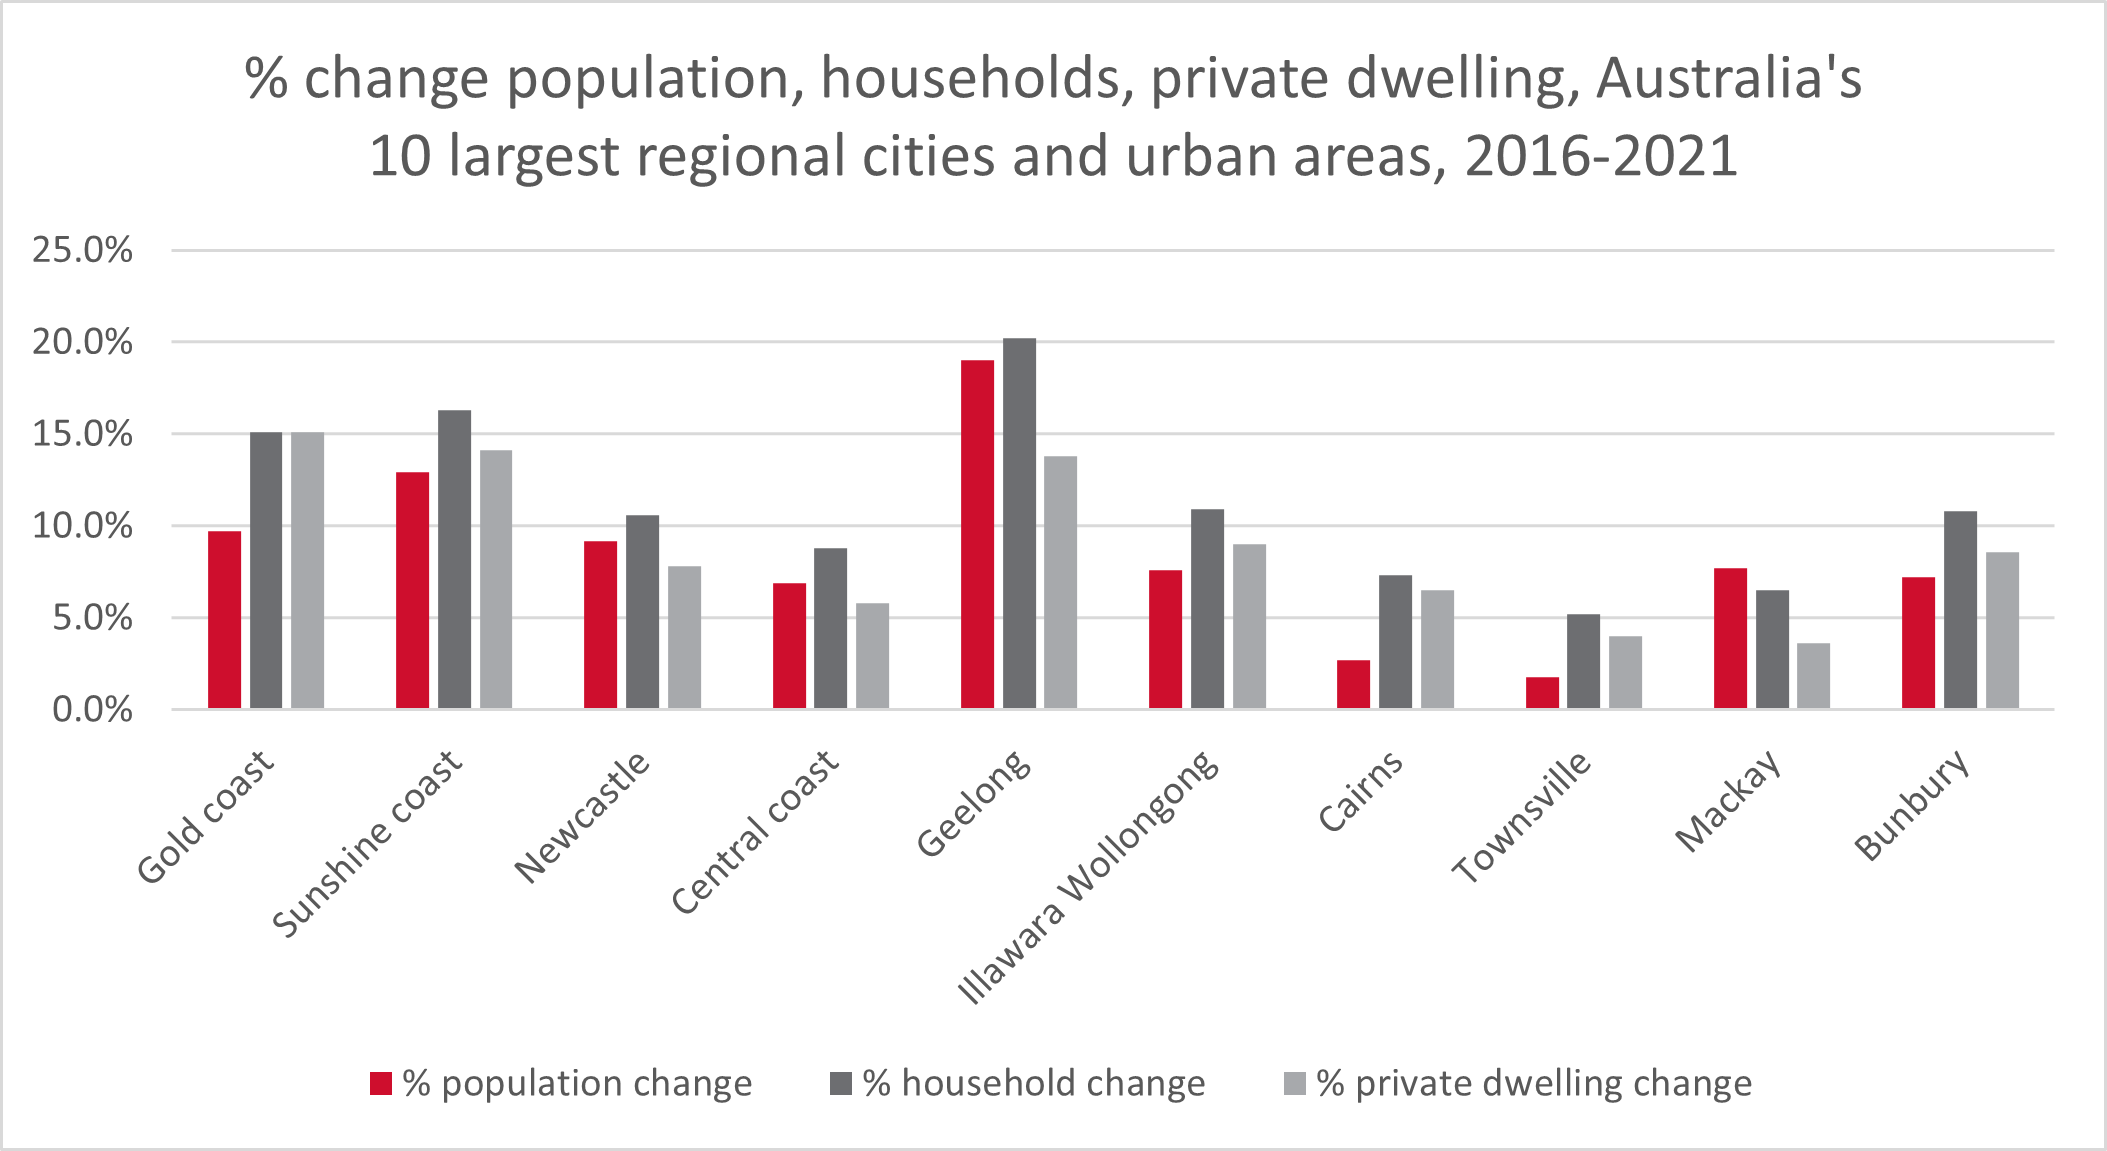
What’s the story in the regions (2016 to 2021)?
The biggest increase in regional population numbers was recorded by the Gold Coast, which saw an increase of 56,912 people (a 9.7% increase since 2016). While the Gold Coast showed a rate of increase in total private private dwellings that matched the increase in households (both at 15.1%), the rest of Australia’s most populous regional cities and urban areas all had increases in households that were greater than increases in private dwellings (similar to the case with all capital cities apart from Sydney and Melbourne). This suggests that lack of new housing supply is a concern in regional areas too.
The regional city of Geelong in Victoria recorded the biggest rate of increase in both population (19% or 51,912 people) and in households (20.2% or 20,701 new households) while recording only 17,440 new dwellings (a 13.8% increase).
Figure 5: Percentage change in population, households, private dwellings, Australia’s 10 largest regional cities and urban areas, 2016-21