Census reveals massive growth in larger apartment buildings
The 2021 ABS Census reveals that, across Australia, in the last five years, there was a 17.5 percent increase in the number of two storey (or more) semi-detached houses and townhouses and a very large 50.9 per cent increase in the number of flats or apartments in buildings that are four or more storeys high. In part this could reflect governments’ focus on increasing urban density by encouraging the building of more high-rise residential buildings. The increase in taller apartment buildings may also support the 17.2 per cent increase in lone person households recorded in Australia between 2016 and 2021.
Even though the number of separate detached houses as a proportion of all occupied private dwellings has fallen over the decade from 2011 (from 75.6% to 72.3% of all occupied dwellings), the number of new separate houses increased by 11.1 per cent between 2016 and 2021, a rate comparable to the overall increase in occupied private dwellings (11.9%). This 11.1 per cent increase between 2016 and 2021 (668,794 new separate houses) was also a large increase from the rather low 3 per cent increase seen between 2011 and 2016 (when only 177,214 new separate houses were built).
Figure1: Percentage change in type of dwelling built in Australia, 2011-16 and 2016-21
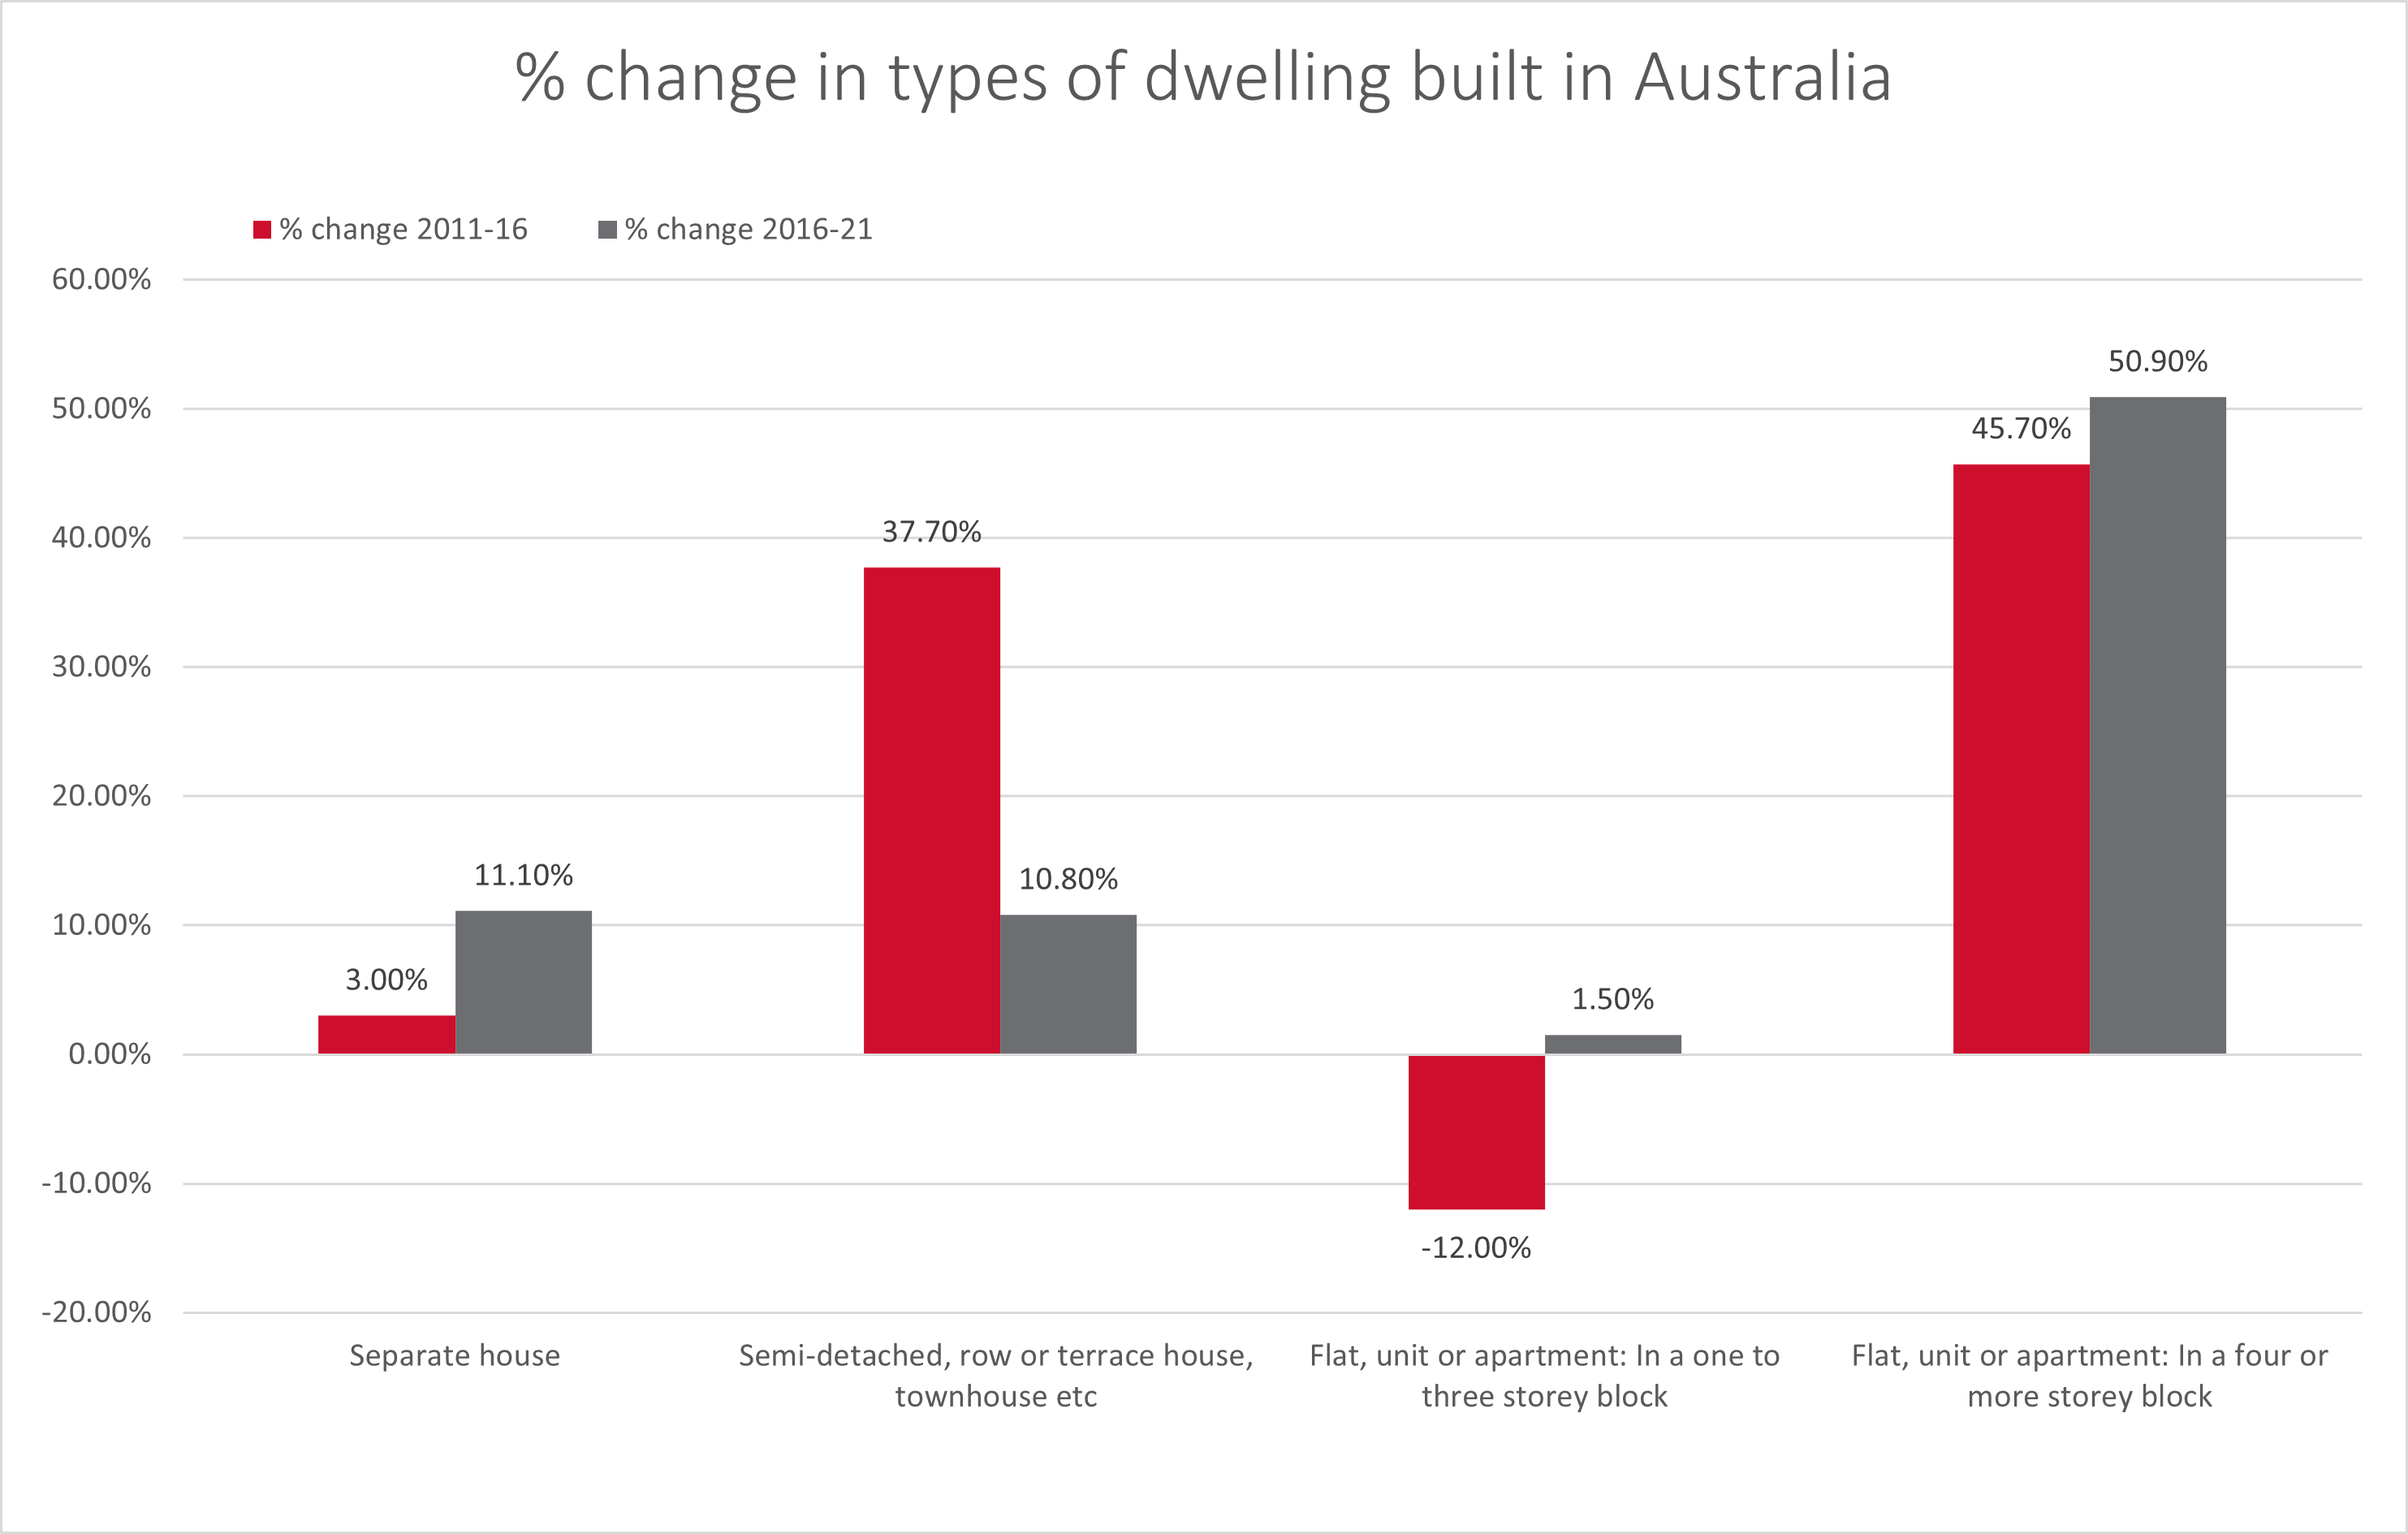
Source: ABS Census 2011, 2016 and 2021
All up, there was an increase of 525,757 private occupied dwellings between 2011 and 2016 (a 6.8% increase) compared to a much greater 989,140 increase in private occupied dwellings (an 11.9% increase) between 2016 and 2021. Some of the apparent reduced building activity after 2011 may be due to the impact of the global financial crisis (GFC) on households’ reduced ability to fund buying a new home.
The proportion of unoccupied private dwellings to all private dwellings has reduced from 10.7 per cent in 2011 to 10.1 per cent in 2021 (after spiking at 11.2 per cent in 2016). While we can’t know definitely, it is possible that some of this increase in occupancy is due to members of some household relocating to holiday houses during COVID lockdowns while also maintaining city/suburban residences.
Table 1: Number of private dwellings, Australia 2011, 2016 and 2021.
|
|
2011 Dwellings
|
2016 Dwellings |
% change 2011 to 2016 |
2021 Dwellings |
% change 2016 to 2021 |
|---|---|---|---|---|---|
|
Total occupied private dwellings |
7,760,320 |
8,286,077 |
6.8% |
9,275,217 |
11.9% |
|
Occupied dwellings as % of total private dwellings |
89.3% |
88.8% |
|
89.9% |
|
|
Total unoccupied private dwellings |
934,470 |
1,039,874 |
11.3% |
1,043,776 |
0.4% |
|
Unoccupied dwellings as % of total private dwellings |
10.7% | 11.2% | 10.1% | ||
|
Total private dwellings |
8,694,790 |
9,325,955 |
7.3% |
10,318,997 |
10.6% |
Source: ABS Census 2011, 2016 and 2021