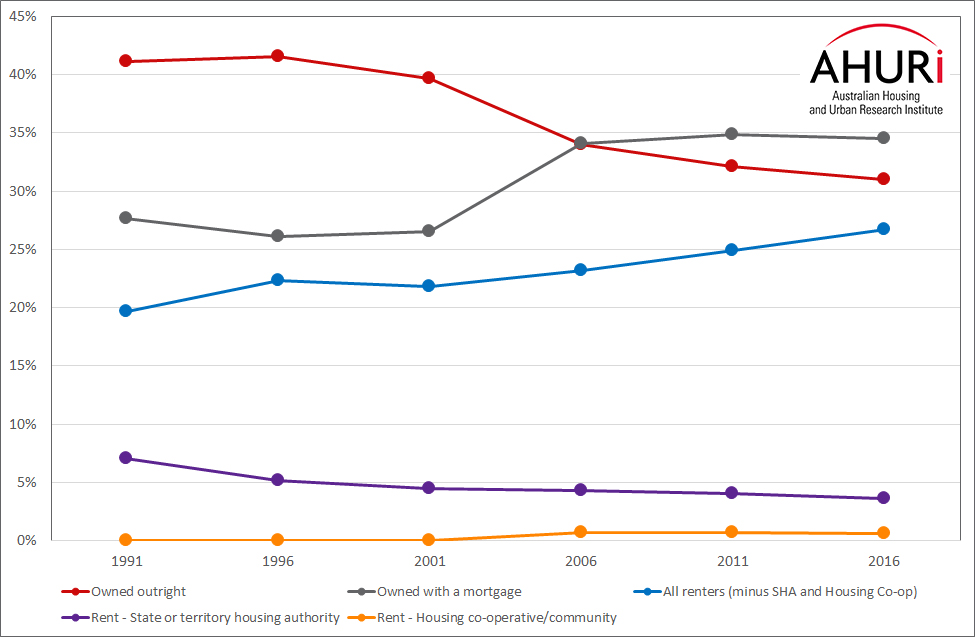
The 2016 Census reveals the proportion of home owners (i.e. those who either owned their home outright or were still buying) dropped from 68.6 per cent of all households in 1991 to 65.5 per cent in 2016. The biggest change during this time period was a fall of 10 percentage points in outright home owners between 1991 and 2016, and an increase of nearly 7 percentage points in the proportion of households paying off their mortgage.
Figure 1 clearly shows the biggest changes for both these categories occurred between the 2001 and 2006 Censuses.
The proportion of households renting in the private market increased by over 7 percentage points during the 25-year time frame 1991–2016, while the proportion in social housing (which includes public and community housing) dropped from 7.1 per cent of all Australian households to 4.2 per cent.
Figure 1. Census Australia housing tenure data 1991–2016