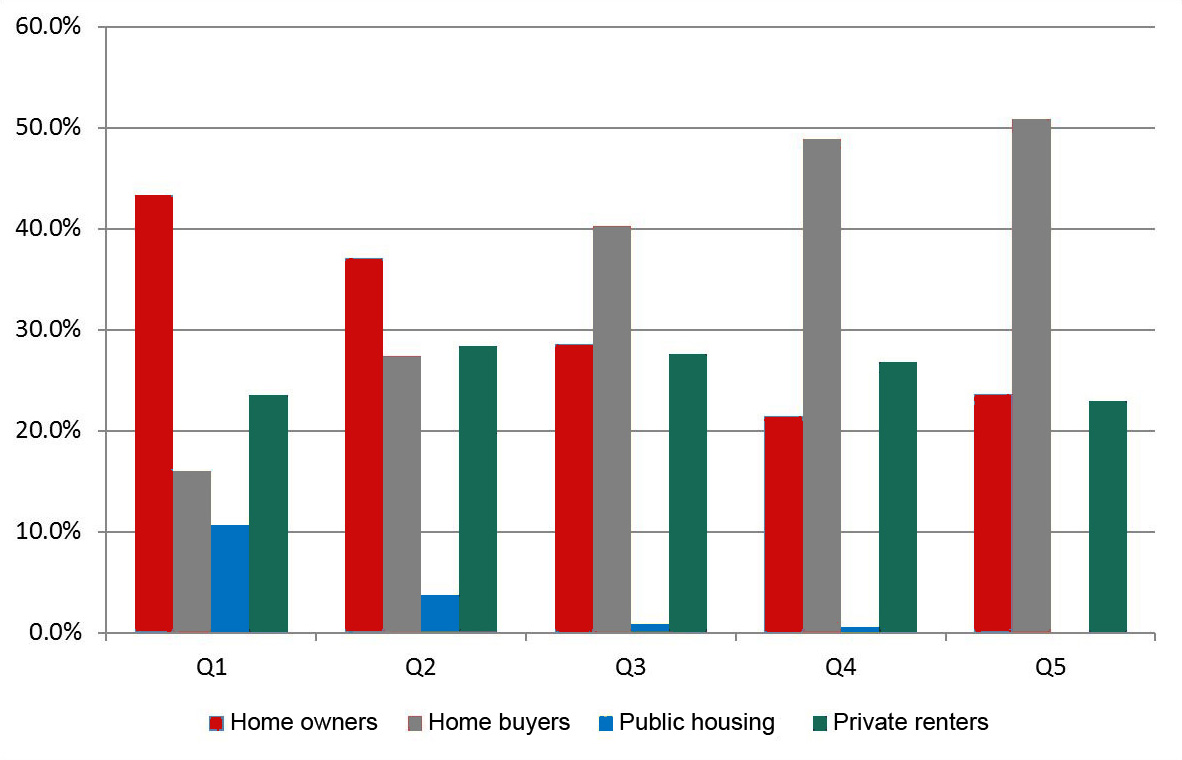
In 2013–14, the cohort of Q1 households had the largest proportion of households who were outright home owners. It is likely many of these Q1 households comprised retired householders living in the homes they bought when they were working and are now on government support such as age pensions.
Indeed, 44.5 per cent of households aged 65 and over were Q1 households and 63.7 per cent of 65+ households' main source of income came from Government pensions and allowances. This highlights the importance of Q1 households buying into home ownership during their working careers. The Q1 cohort also had the lowest proportion of households buying their own home.
In addition, the data shows the effective targeting of social housing in that Q1 households had the highest proportion of households living in public housing (10.7%), which was nearly three times the proportion of Q2 households in public housing (3.7%).
The distribution of households living in private rental was fairly even across all five quintiles, varying from a low of 22.9 per cent of Q5 households to a high of 28.4 per cent of Q2 households.
Options for increasing the supply of affordable housing are presented in our policy analysis, 'Increasing the supply of affordable housing for low-income tenants'.
Figure 1. Percentage of households by income quintile in each housing tenure, 2013-14