Growing suburban homelessness rates are driven by shortage of affordable rental housing
10 Oct 2024
According to new AHURI research, homelessness has grown in the suburbs of Australian capital cities, especially in areas with greater shortages of affordable private rental housing (relative to demand from low income households).
The research, ‘The changing geography of homelessness in Australia (2001–21) and its structural drivers’, undertaken for AHURI by researchers from Swinburne University of Technology, Launch Housing and RMIT University, investigates the changing geography of homelessness in Australia from 2001 to 2021 and the role of structural factors, such as poverty and supplies of affordable rental housing, in shaping this geography.
Homelessness is increasing in Australian suburbs
In exploring the geography of homelessness, the authors found that homelessness has become more suburban over time, with more than 60 per cent of those experiencing homelessness at the 2021 Census found in Australia’s capital cities (up from around 48% in 2001).
‘We found that there were declining rates of homelessness in the CBD areas of all capital cities (except Hobart and Sydney) between 2001 and 2021,’ says lead researcher Dr Deb Batterham, from Swinburne University of Technology and Launch Housing. ‘However homelessness is spreading out across capital cities and becoming more suburban over time.’
For a breakdown of changes in homelessness rates by capital city, please see below.
Areas with a shortage of affordable housing have highest rate of homelessness
The research examined relationships between low income households renting in the private market and the rental houses they can afford.
‘More people experienced homelessness in areas which had a greater shortage of rental dwellings affordable for low income households relative to demand, and this relationship became stronger over time,’ says Dr Batterham.
Homelessness was also higher in areas with smaller supplies of social housing relative to demand. The research suggests that an increase in social housing will further significantly reduce homelessness.
Better targeting of local responses to homelessness is needed
In areas with a greater shortage of affordable rental dwellings relative to demand from low-income households, a higher percentage of Specialist Homelessness Service clients are returning for support after having been assisted.
‘As the majority of people experiencing homelessness tend to remain in the same area, localised responses to homelessness are really important. Homelessness services and affordable housing options need to be expanded in areas where they are needed, and not just where existing services are located,’ says Dr Batterham.
‘In order to provide housing to clients who accessed a Specialist Homelessness Service in 2021–22, we estimate that around 158,000 one- to two-bedroom dwellings and 25,000 three-or-more-bedroom dwellings are needed nationally. These dwellings must be affordable and available to households with the lowest incomes (quintile 1) with a maximum rent of $220 per week ($2021). Social housing is the best way to do this,’ says Dr Batterham.
Where is homelessness highest across Australian capital cities?
- In Greater Sydney, high homelessness rates extended in a corridor 40 kilometres west of the CBD as far as Mount Druitt, Fairfield and St Marys. Of 13 suburban clusters (classified as Statistical Area Level 3 or SA3s) within a 10–15 kilometre radius of the Sydney CBD, eight had rates of homelessness amongst the highest rates nationally. These areas included Sydney Inner, Canterbury, Strathfield, Burwood, Ashfield, Marrickville, Sydenham and Petersham. Low rates of homelessness were evident in the northern and north-west regions (e.g. Manly and Ku-ring-gai) as well as in the south of Greater Sydney in areas such as Sutherland, Menai and Heathcote on the coast.
- In Greater Melbourne, very high rates of homelessness were recorded close to the CBD: in Maribyrnong, Port Phillip, Melbourne City, Yarra and Stonnington East. Four other SA3s also recorded high homelessness rates: Darebin North, Whitehorse West, Monash and Dandenong. High homelessness rates were also recorded in Casey North and Frankston, around 40 kilometres south-east of central Melbourne, and also in Brimbank and Tullamarine–Broadmeadows.
- In Brisbane, a very high rate of homelessness was found in the central city area (the Brisbane Inner SA3). Outside the CBD, the highest homelessness rate was recorded in Springwood–Kingston, 20 kilometres south-east of the CBD, while three other SA3s recorded a slightly lower homelessness rate: Holland Park–Yeronga in inner Brisbane, Sunnybank in the middle ring and Browns Plain.
- In Perth, the CBD area had a very high rate of homelessness. Two other SA3s also had high rates of homelessness: Swan (in the north-east) and Fremantle (south-west of the CBD).
- In Adelaide, the CBD area had a very high rate of homelessness. In addition, all the SA3s stretching between 5 and 30 kilometres north of the CBD had high homelessness rates, which included areas such as Port Adelaide East and West, Salisbury and Playford.
- In Darwin, while the CBD area had a very high rate of homelessness, high rates of homelessness stretched across all of the city.
- In Hobart, the CBD area had a very high rate of homelessness as did an SA3 extending north-west of the city (Hobart North West).
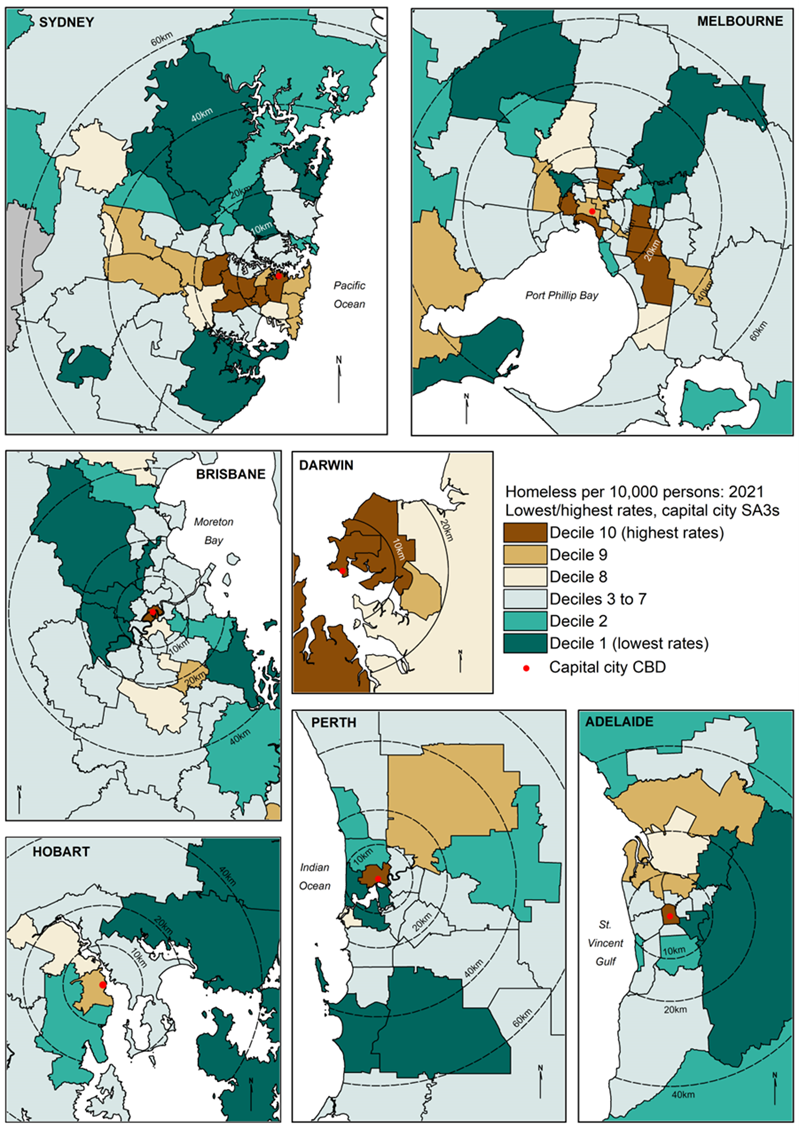
Lowest and highest rates of homelessness by nationwide decile, state and territory capital city SA3s, 2021
Rates of homelessness per 10,000 persons are presented below at the small area level (Statistical Area Level 3, or SA3) for each capital city. These figures map these rates by decile (10 equal groups) in 2021, highlighting the highest, nationwide rates (deciles 8, 9 and 10) and the lowest rates (deciles 1 and 2), with the middle deciles (3–7) grouped together.
The maps show that each capital city in 2021 had at least one SA3 close to their CBD area with a very high rate of homelessness (decile 9 or 10).
Read the research
The changing geography of homelessness in Australia (2001–21) and its structural drivers