
Briefs
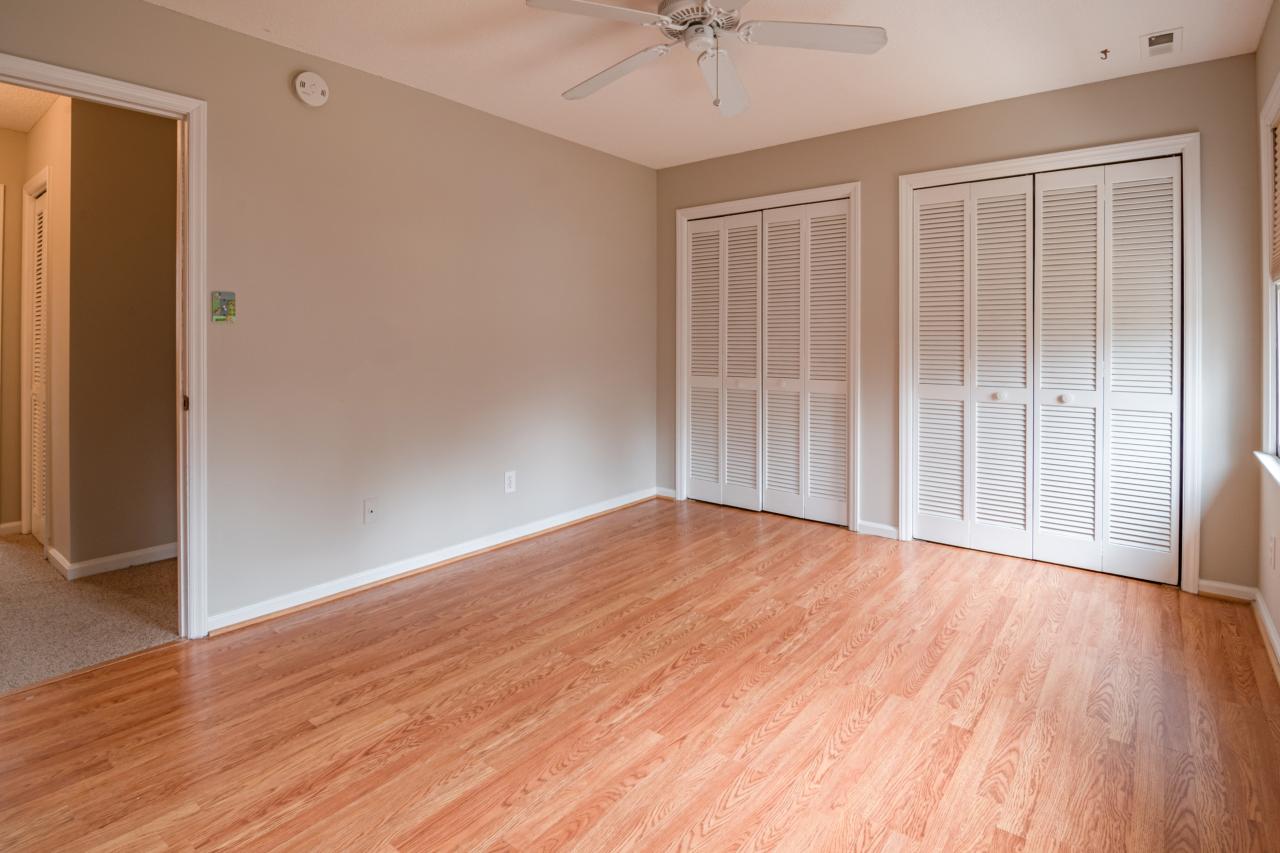
Are there 1 million empty homes and 13 million unused bedrooms?
Very low supplies of rental housing in some parts of Australia have raised concerns about significant numbers of unoccupied housing as revealed by the 2021 Census, and have some local governments asking whether unoccupied housing can be redirected to the private rental market.
A ten year story of population, households and private dwelling numbers, drawn from the ABS Census 2011 to 2021.
The story of the 2021 ABS Census and the interplay between increases in population and numbers of households and increases in numbers of private dwellings between 2011, 2016 and 2021 is quite nuanced. For Australia, the rate of population growth slowed slightly between 2016 and 2021 (8.6% growth) when compared with the rate of growth in the years 2011 to 2016 (8.8% growth).
2021 Census reveals fewer social housing households across Australia
The release of the 2021 ABS Census data shows that the number of social housing households (which includes both public housing and community housing) fell between 2011 and 2021 across Australia except in the Northern Territory, which had a 3.3% increase over that time period. While Tasmania recorded a 5.3 per cent fall between 2011 and 2016, it turned this around to show an increase of 4.6 per cent between 2016 and 2021.

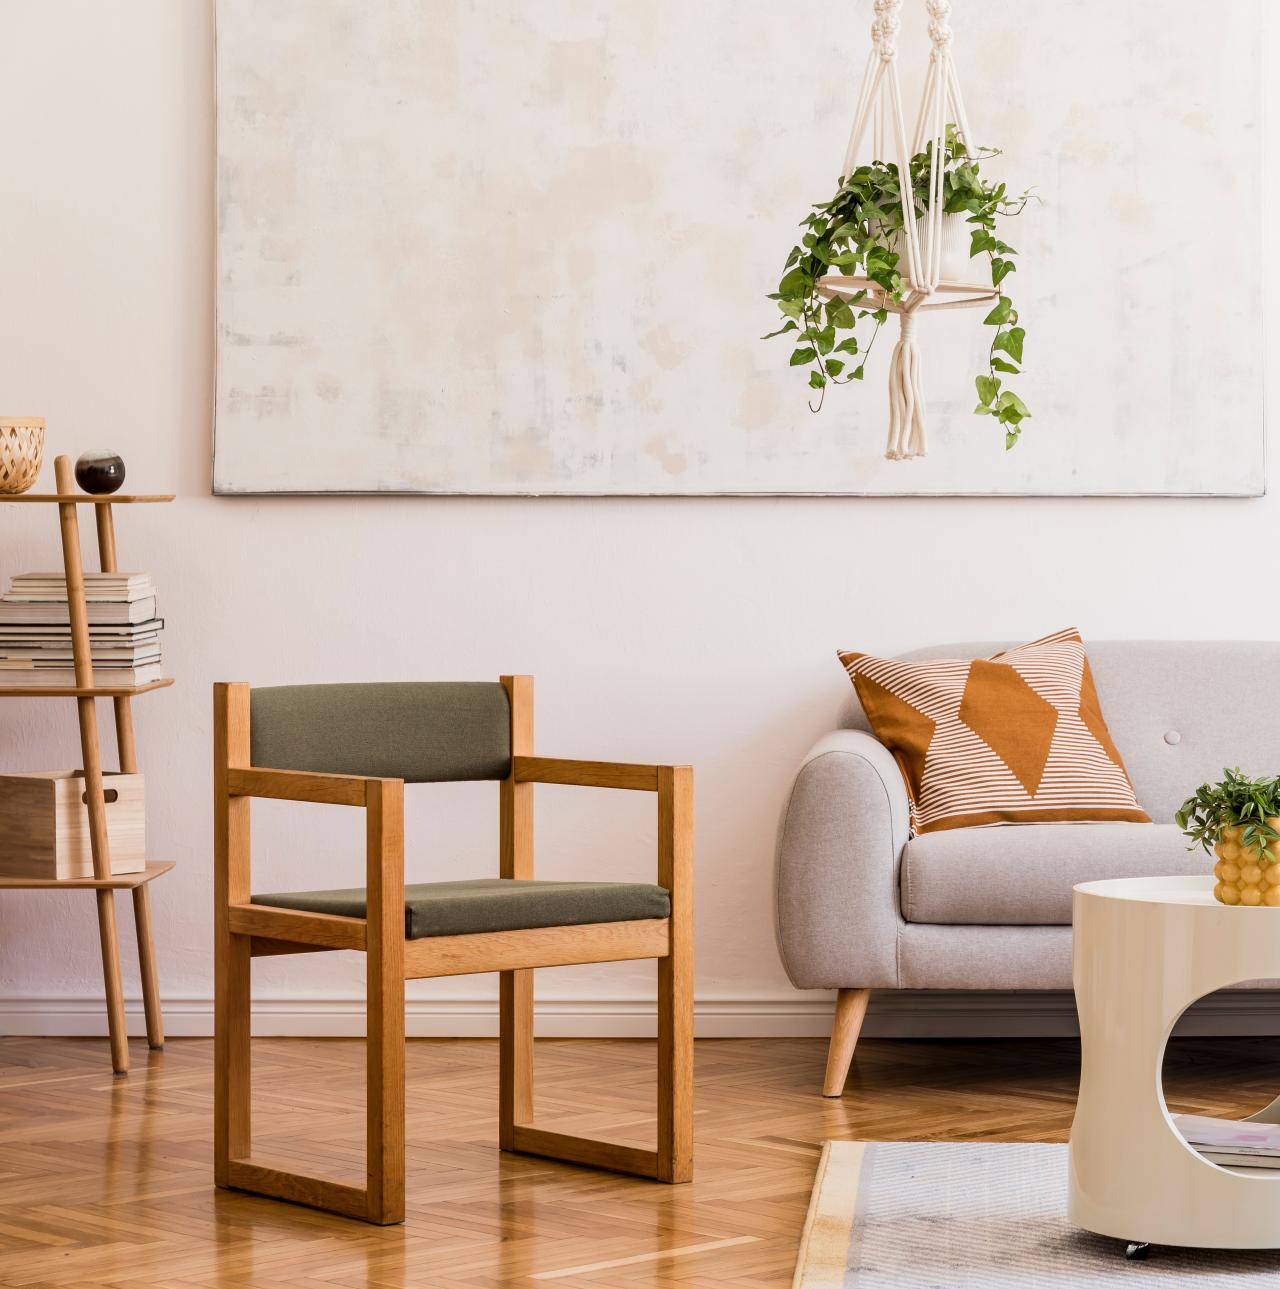
Census reveals changes in the makeup of households 2011 to 2021
The makeup of Australian households has changed over the ten years between the 2011 and 2021 Census.
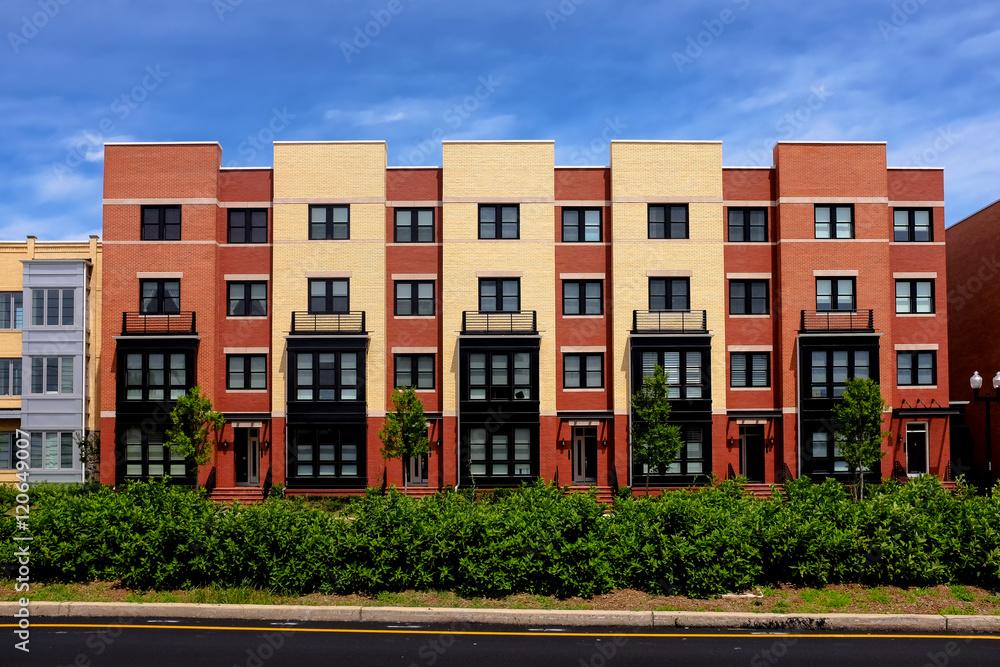
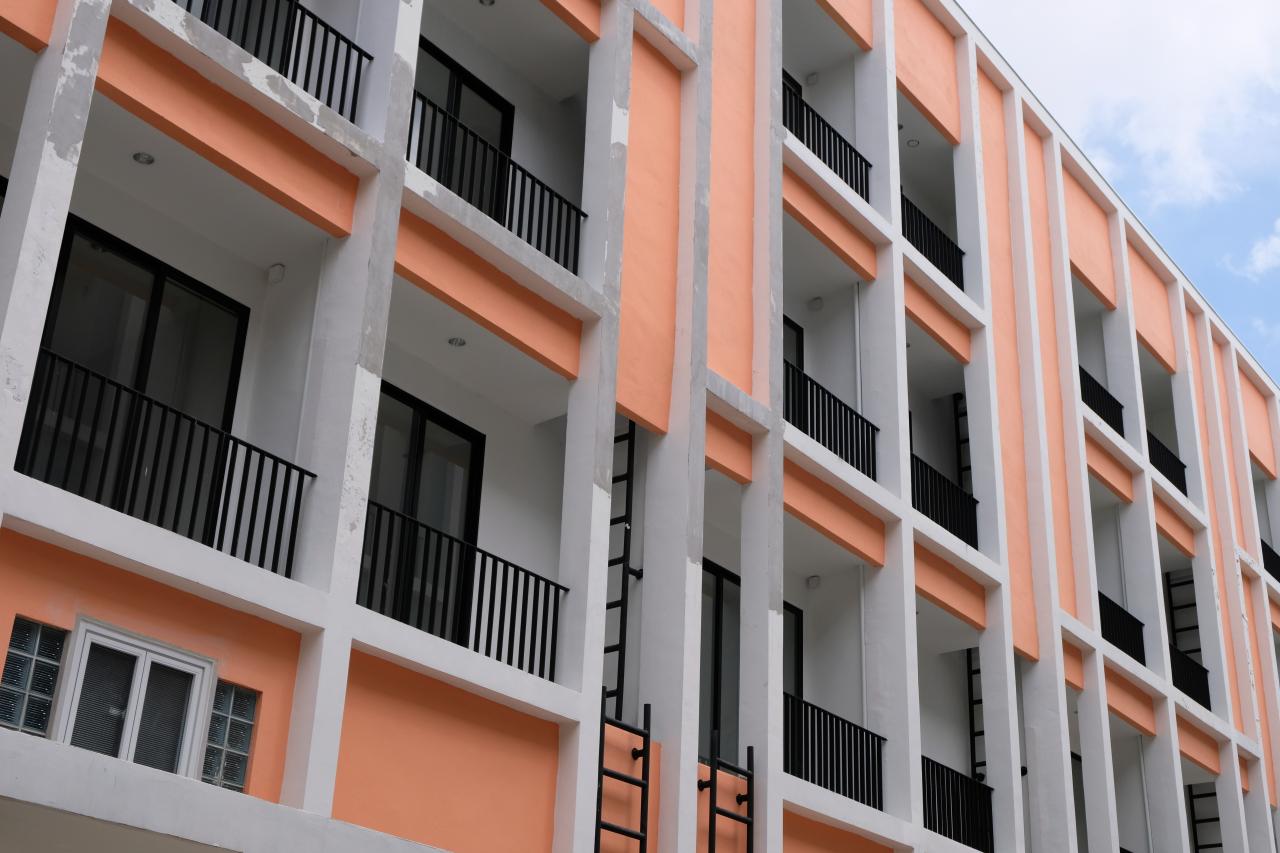
What kinds of homes are we building?
Census reveals massive growth in larger apartment buildings