
Briefs

What are Managed Investment Trusts and how can they fund affordable housing?
Written in consultation with Professor Graeme Cooper and Manuel Makas, Director and Head of Real Estate at Greenwoods & Herbert Smith Freehills. In the May 2017 Budget, the Federal Government introduced a tax measure to ‘stimulate affordable housing through Managed Investment Trusts’, but just what does the proposal offer?

Housing affordability stress: how much rent can lower income households afford?
For an Australian household to be recorded as being in housing affordability stress (HAS) it has to be in the bottom 40 per cent of Australia’s income distribution and have housing costs that are greater than 30 per cent of its income. So what can the Census tell us about the incomes and thresholds of HAS for households in the first (Q1) and second (Q2) quintile (i.e. in the 0% to 20% range and the 21% to 40% range) of Australia’s income distribution?

Do long-term residential leases result in long-term tenancies?
The recent decision by the Victorian State Government to allow the maximum length of residential tenancy agreements to be longer than 5 years raises the question; when it comes to the length of rental leases, how do Australia’s States and Territories compare, and what impact does extending the maximum length have on the take up of longer-term leases?
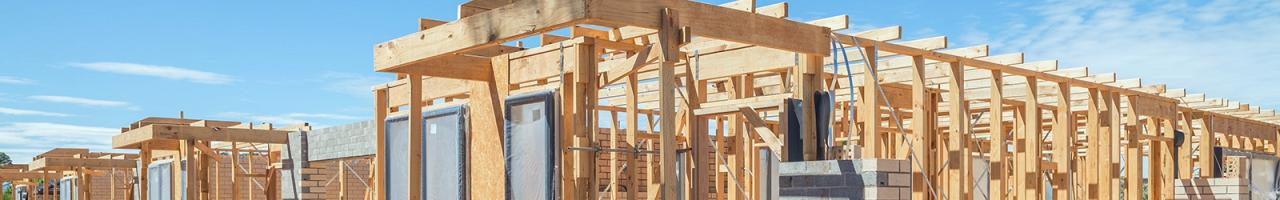
The skew of the new: lower priced housing left out of new housing supply
AHURI research that examined housing supply responsiveness across Australia, reveals that approvals for lower priced houses were a small percentage of all building approvals in 2005–06 and again in 2013–14, with the vast majority of approvals (82.8% in 2013–14) in the 6th to 9th deciles (i.e. the measure of the distribution of house prices), a range covering houses prices of between $306,000 and $795,000.

Census data shows falling proportion of households in social housing
The 2016 Census shows a continuing fall in the proportion of Australian households who live in social housing, from a high point of over 7 per cent of all households in 1991 to 4.2 per cent in 2016 (which is the lowest proportion of households in social housing during the last 35 years).